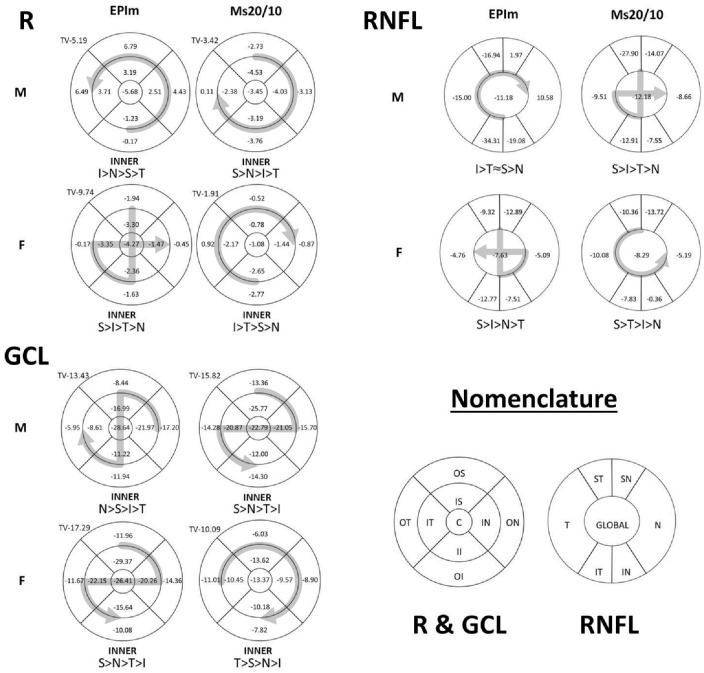
Figure 4.
Neuroretinal percentage loss in OCT sectors and loss trend averaged over 24 weeks of follow-up. R, retina; C, central, II, inner inferior; OI, outer inferior; IS, inner superior; OS, outer superior; IN, inner nasal; ON, outer nasal; IT, inner temporal; OT, outer temporal; IT, inferior temporal; IN, inferior nasal; ST, superior temporal; SN, superior nasal; N, nasal; T, temporal; EPIm, episcleral sclerosis model; Ms20/10, microsphere 20/10 model; TV, total volume; I, inferior; S, superior; N, nasal; T, temporal; >, greater loss than; ≈, similar; M, male; F, female.

