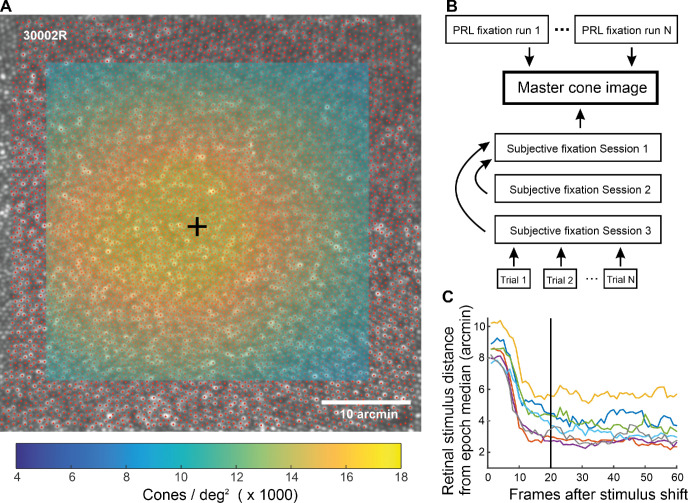
Figure 1.
Determining the cone peak, bringing data from all experiments to common coordinates, and removing irrelevant video frames. (A) The cones were marked (red dots) on the master cone image. The map of cone locations was then convolved with a circular window, leading to a map of cone densities (color mapping), from which a peak location (black cross) could be determined. (B) The procedure of bringing all data of the study to the same coordinates. Each box represents a reference frame image. The arrows point to the image to which the other (at arrow origin) was registered to. The MATLAB functions fitgeotrans, imregcorr, and normxcorr2 were used to register the images. (C) Average retinal stimulus location distance from median location as a function of time (in frames) from stimulus shift. Each line represents the data from one observer and is an average over 75 to 90 2-second periods immediately after stimulus shift. The median was calculated over the 2- to 6-second epoch where the stimulus stayed in one location. To exclude frames, where the observer's gaze had not yet moved to the new stimulus location, data from the first 20 frames (∼667 ms) after stimulus shifts was excluded from further analyses (black vertical line). The distance from the median never goes to zero, as the eye hovers around the median location due to fixational eye movements.

