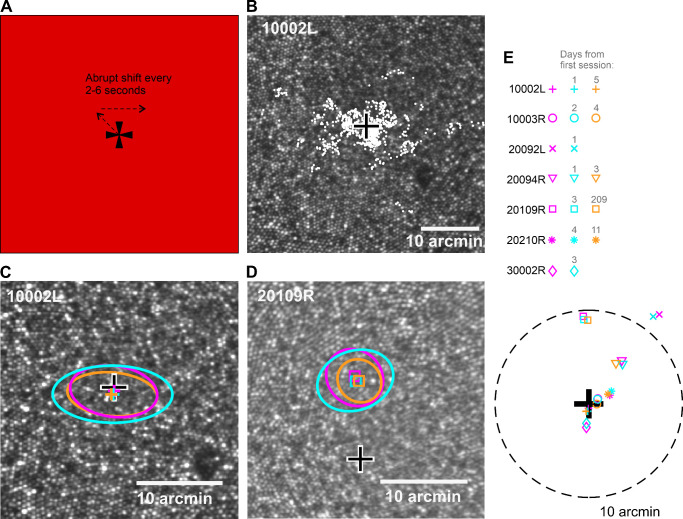
Figure 2.
The PRL was stable across days. (A) The stimulus and the task in the PRL experiment (Experiment 1). The observer fixated the Maltese cross, which shifted every 2 to 6 seconds throughout the 30-second fixation run (see also Supplementary Movie S1). (B) Retinal locations of the target from one 30-second video (white markers) plotted on the observer's master cone image. The black-and-white cross indicates the cone density peak. (C, D) Means (markers) and standard deviations (ellipses) of the 2D Gaussians fitted to retinal target locations measured on different days (different colors) for two representative observers. The means (the colored markers) represent the PRLs for different days. (E) The PRLs relative to cone density peak for all observers (see figure legend). Some observers participated on 2 days (two markers), some on 3 days (three markers). The dashed circle signifies a 10-arcmin distance from the cone density peak. Two data points (orange and cyan cross) have been moved 0.08 arcmin apart to make them both visible, as they were on top of each other.

