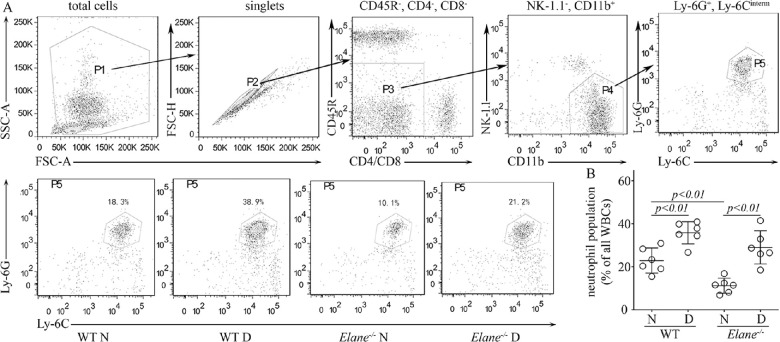
Figure 6.
Peripheral blood phenotyping by flow cytometry. (A) Plots along with gating strategies for neutrophils in the blood of WT and Elane−/− mice are depicted. Top panels – FSC-A versus SSC-A dot plot (P1) are gated to eliminate debris and then singlet cell (P2) was selected on FSC-A versus FSC-H. Non-lymphocyte population was gated on CD11b+ (P3 and P4) to eliminate T cells (CD4+ and CD8+), B cells (CD45R+), and NK cells (NK1.1+), then Ly6G and Ly6C antibodies were used to define the neutrophil (Ly6G+Ly6Cinterm) where classical monocytes (Ly6G−Ly6Chigh) and nonclassical monocytes (Ly6G−Ly6Clow) were eliminated. Bottom panels – Flow dot plots represent neutrophils in various groups. (B) Graph summarizes the neutrophil population per genotype. Mice are 8 months of diabetes; n = 6 per group.

