Figure 2.
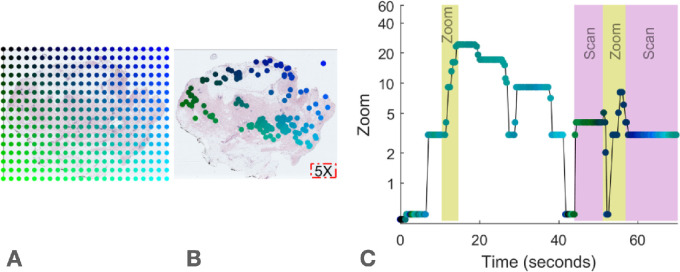
Spatial and temporal representations of fixations from a pathologist interpreting a digital whole slide image. (A) Color conventions for this representation. We created a colormap for each case to enable visualization of where the pathologists looked in the case as a function of time as in panel C. (B) Digital whole slide image at minimum magnification. For reference, the area of viewable tissue at magnification ×5 is represented by the red box in the lower right corner. Green-blue dots represent eye fixations co-registered to the biopsy coordinates. (C) Timeseries of the same fixations in B. Time of each fixation is on the horizontal axis, and zoom (magnification) level of each fixation is on the vertical axis. Scanning is measured cumulatively as distance between fixations, adjusted for the width of viewable tissue at the time of each fixation (determined by zoom level at each fixation). Zooming is measured cumulatively as the difference in zoom level of each fixation. Each doubling or halving of zoom level increments the zooming metric by 1. Relatively high periods of zooming and scanning are indicated by the yellow and pink bars, respectively.

