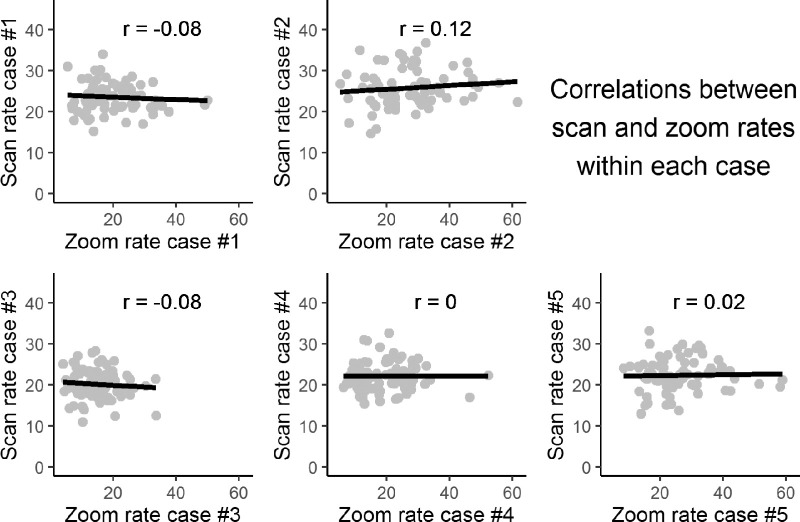
Figure 4.
Scan rate plotted against zoom rate across pathologists interpreting the same case, for each of five distinct breast biopsy cases. Each dot represents a single pathologist. These five cases were viewed by every pathologist in our study. Due to data quality, sample sizes for correlations range from n = 77 to n = 85. None of the correlations was statistically significant: p values for all correlations are >0.3.

