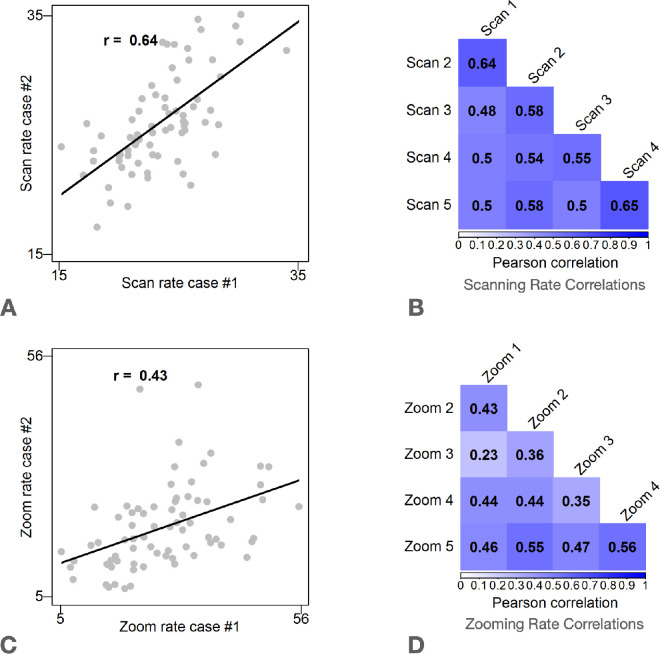
Figure 5.
Scan and Zoom rate correlations. Results show that participants who had a high scanning rate on one case tended to have a high scanning rate on other cases. Due to exclusions from poor data quality, sample sizes for correlations range from n = 69 to n = 79. (A) Scatterplot of scan rate measured between Case 1 and Case 2. Each dot represents one pathologist who interpreted Cases 1 and 2. (B) Scan rate correlations for the five cases viewed by all participants. All p values <0.044. (C) Scatterplot of zoom rate measured between Case 1 and Case 2. Each dot represents one pathologist. D: Zoom rate correlations for the five cases viewed by all study participants. All p values <0.001.

