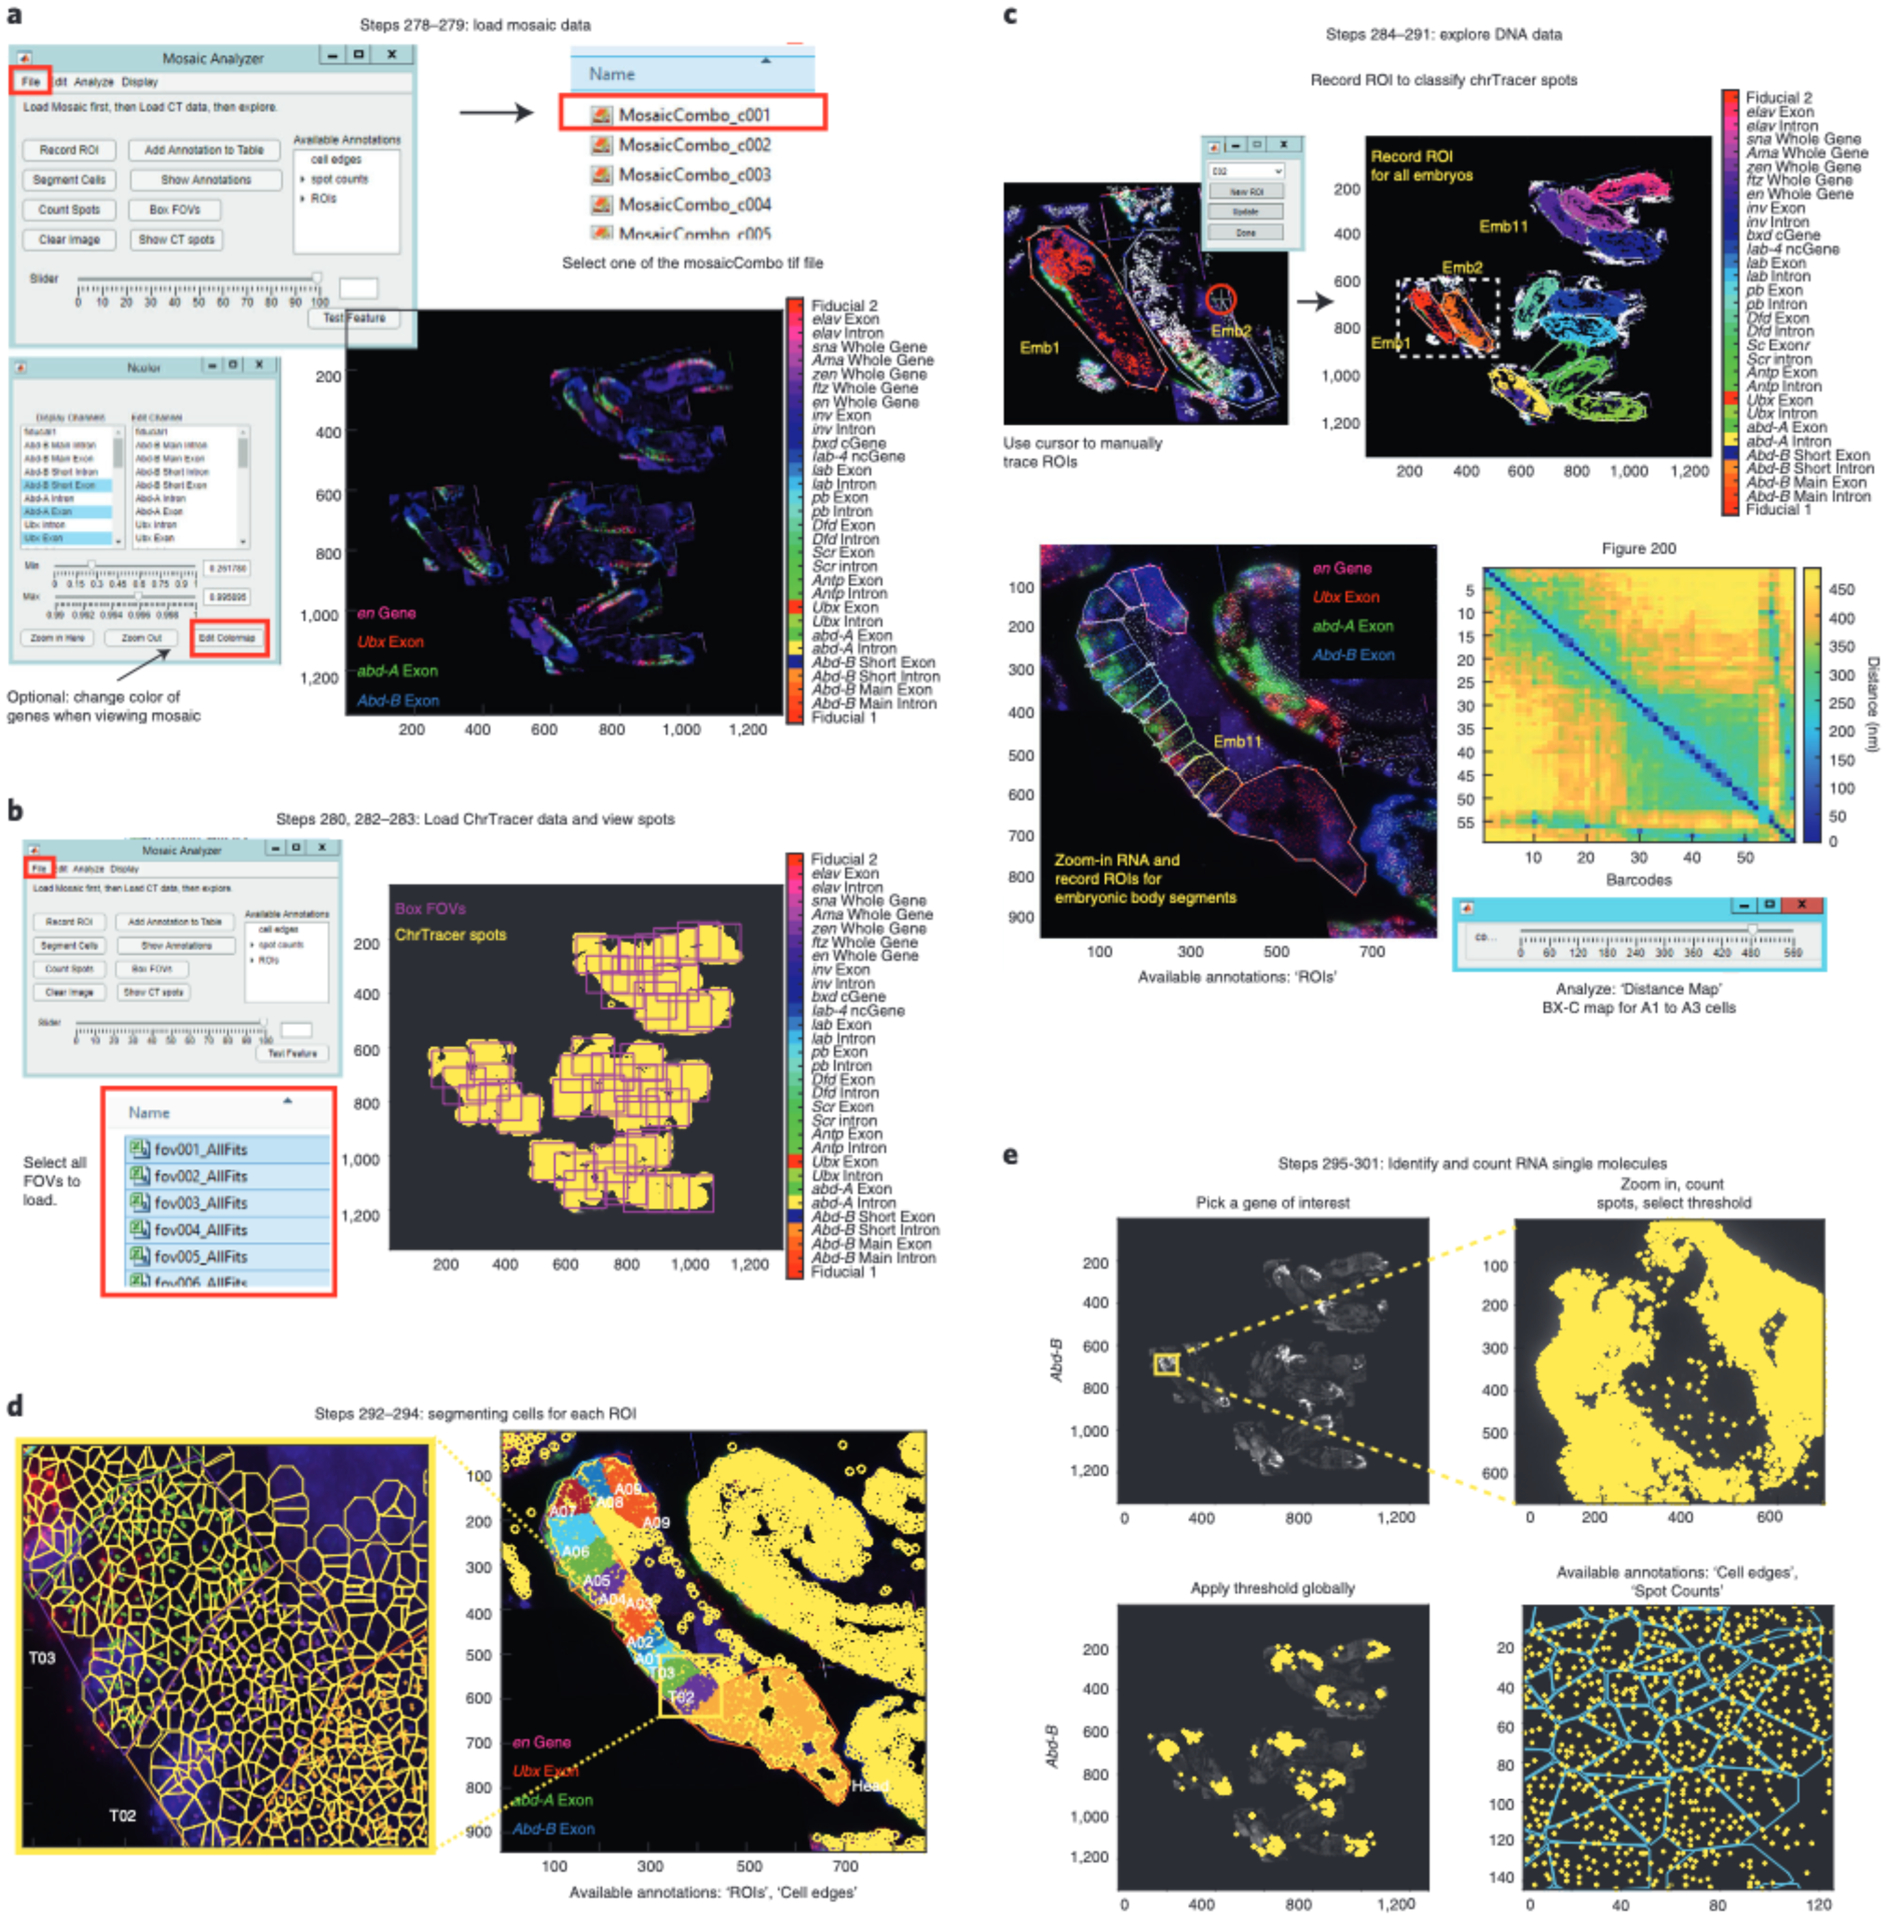
Fig. 13 |. MosaicAnalyzer GUI.

a, Load RNA-DNA registered mosaic by clicking on ‘File’ (highlighted with a red box) on the MosaicAnalyzer GUI and then clicking on ‘Load Mosaic (highlighted with a red box)’. Search for your directory path and open one of the ‘ComboMosaic_cX.tif’ files. If you have previously saved annotations, click ‘File’ and ‘Load Annotations’. The names of the annotations will appear on the right side of the MosaicAnalyzer GUI as shown here. In this example, RGB values for the BX-C exonic genes (Ubx in red, abd-A in green, and Abd-B in blue) are adjusted for visual purposes. b, To load ChrTracer3 processed tables, click ‘File’ and then ‘Load CT Data’. Find the directory path that contains all the ChrTracer outputs and click on all the ‘fovX_AllFits.xlsx’ files (highlighted with a red box). Once loaded, you can click ‘Show CT spots’ to see the position of all fiducial spots in the mosaic (shown as yellow outlined circles). You can also click ‘Box FOVs’ to see the outline of all FOVs. c, Click ‘Record ROI’ and use the bounding polygon cursor to trace around embryos. Note that all the fiducial data inside Embryo (Emb) 1 are red and match the outline of the traced embryo. Emb 2 is in the process of being traced and the polygon cursor is highlighted by the red circle. Each embryo is classified as a specific ROI and all are shown by different colors after tracing. For tracing embryonic segments, zoom into an embryo and adjust the Min/Max pixel intensity of the gene(s) of interest. Using ‘Record ROI’ trace around embryonic segment. Again, notice how fiducial data inside ROIs/embryonic segments change colors after being traced. Additionally, you can generate distance maps for the selected ROIs using MosaicAnalyzer. Map from A1, A2, and A3 cells from wild-type embryos 10–12 hpf, showing pairwise distances between all 52 barcodes that traced the 330-kb BX-C locus (chr3R:12.46–12.79 Mb (dm3)) at 3-kb resolution. The five loop-like structures that appear after barcode ‘52’ correspond to the barcodes that were re-labeled after the experiment. The slider under the distance map is used to select the largest distance shown on the map. d, Segment individual cells by clicking ‘Count Spots’. Display both ‘ROI polygons’ and ‘cell edges’ annotations to show the color coded individually segmented cells in each embryonic body segment. e, Example of identifying and counting Abd-B exonic molecules. Zoom-in to the posterior region of the embryo where Abd-B is expressed and adjust the threshold on the MosaicAnalyzer GUI slider to display the appropriate number of Abd-B exonic molecules (shown in yellow). Zoom-out and apply the threshold to the entire mosaic. Zoom into a region of the embryo to view Abd-B exonic spots by entering ‘Counted spots’ in ‘Show Annotations’. You can also display segmented cells (in cyan) on top of the exonic spots.
