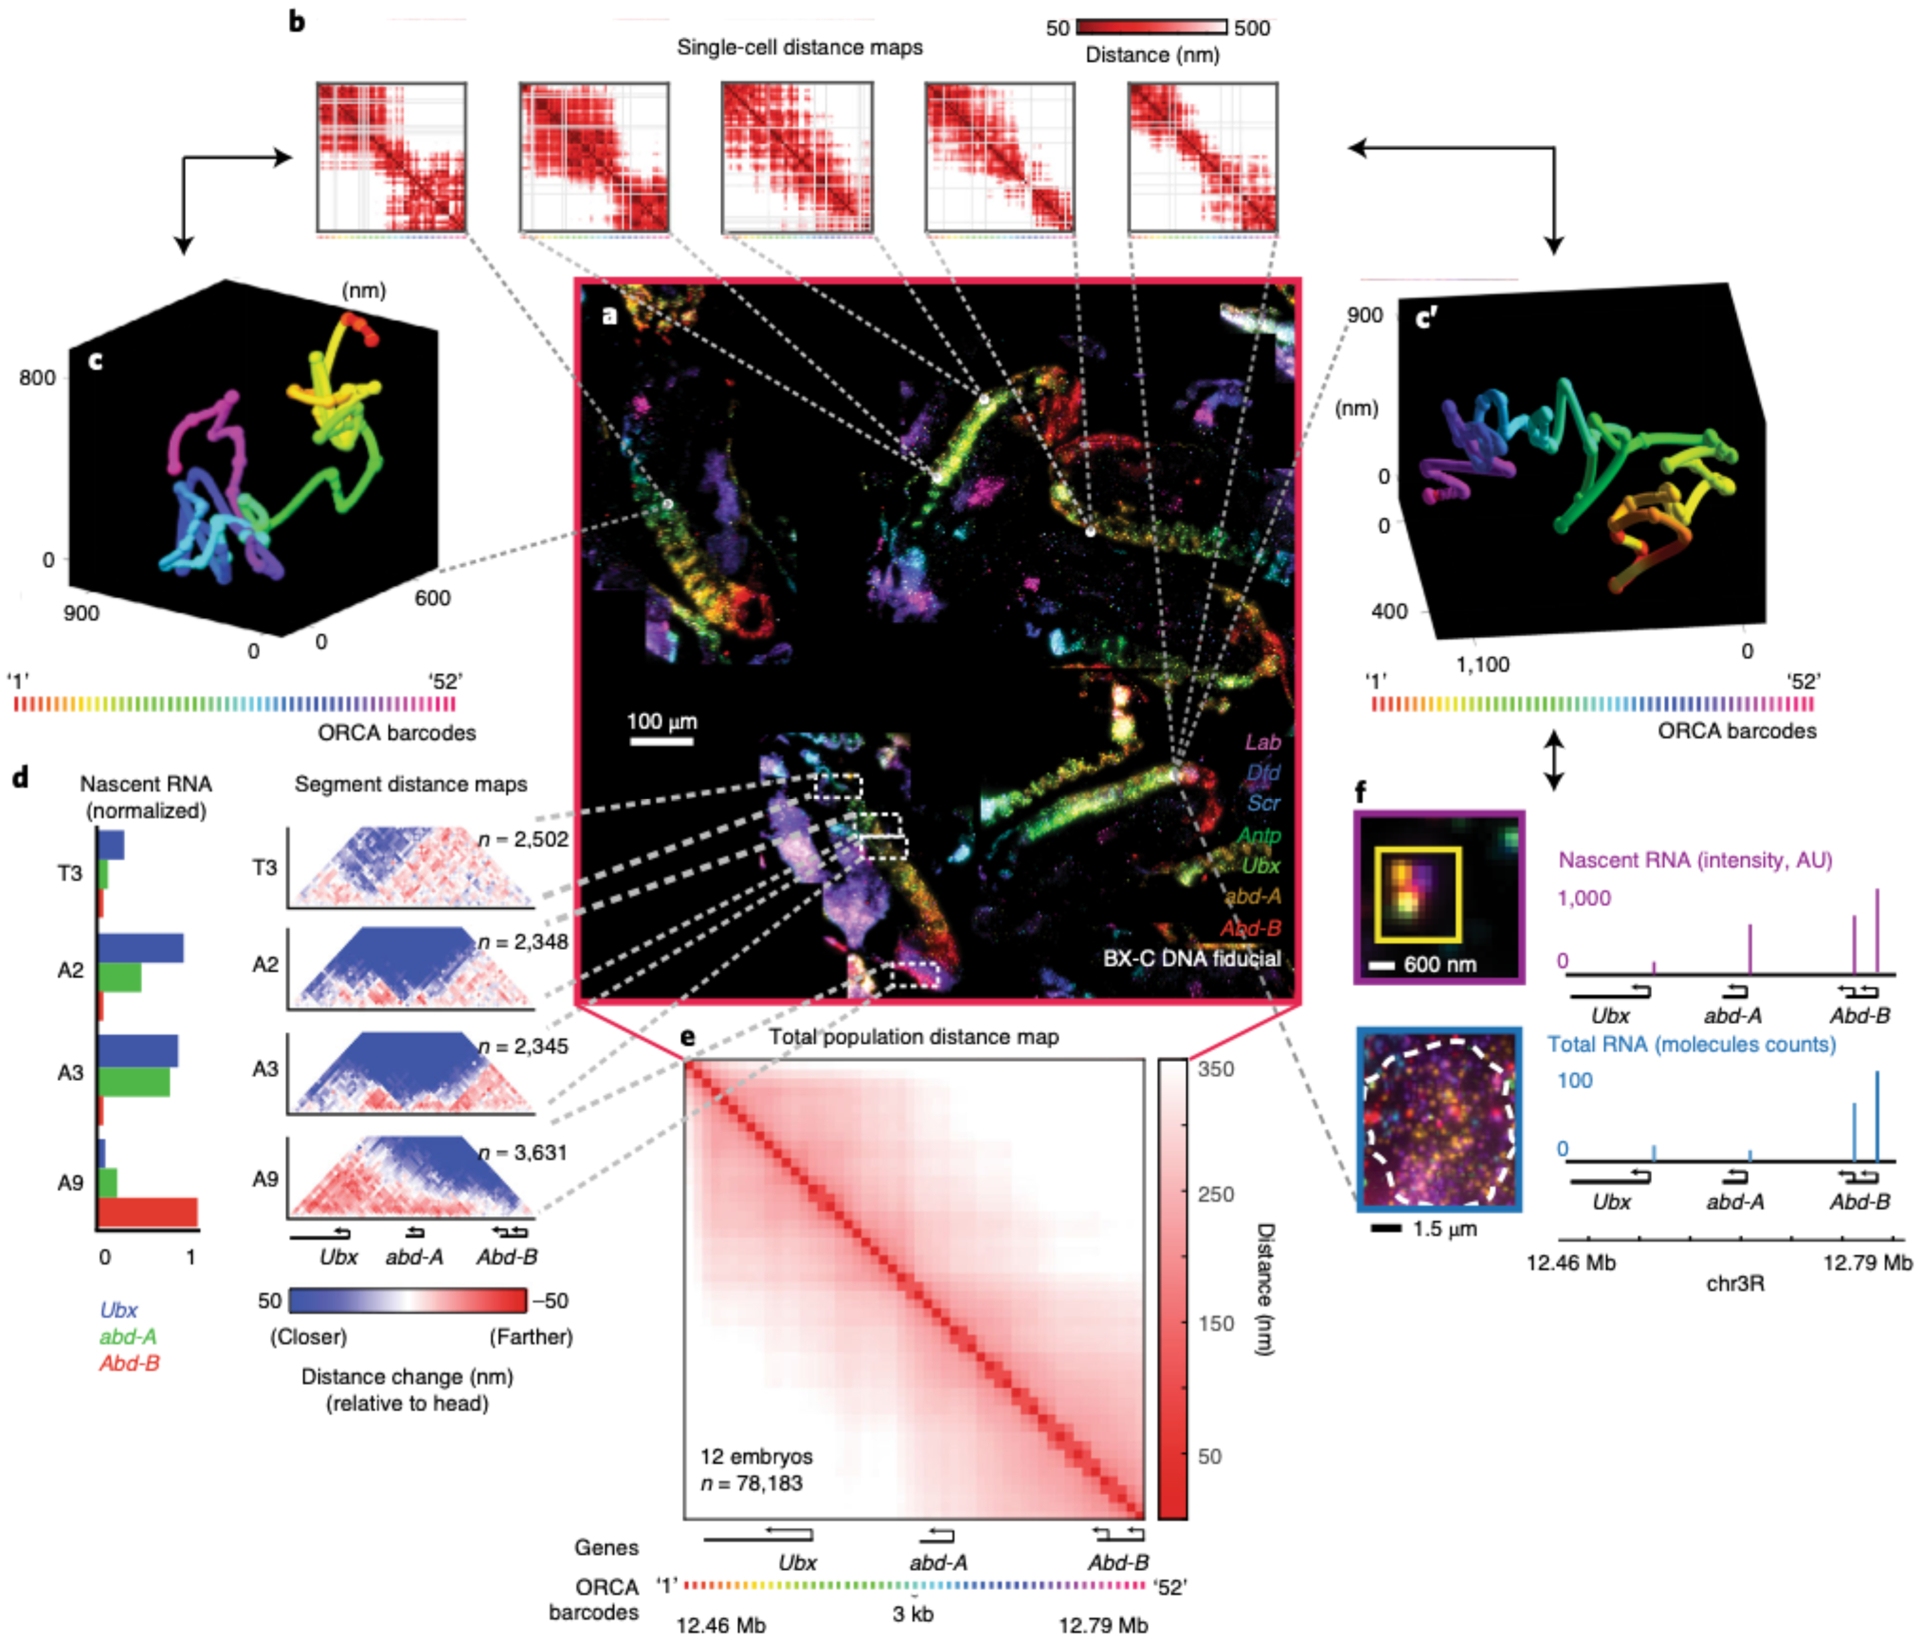
Fig. 14 |. Data generated from a single RNA + ORCA labeling experiment.

Overview of the multiple outputs that can be generated within an experiment. This 10–12 hours post fertilization (hpf) Drosophila embryo data was previously published13 and is the final result from the data analysis performed in Figs. 10–13. a, The mosaic in the center displays 7 mRNAs out of the 29 labeled RNA species that were used to identify specific embryonic body segments. mRNAs are shown for Lab (purple), Dfd (blue), Scr (cyan), Antp (green), Ubx (lime green), abd-A (orange), and Abd-B (red). Additionally, BX-C DNA fiducial spots are shown in white. ORCA was used to image the 330 kb BX-C locus (chr3R:12.46–12.79 Mb (dm3)) at 3 kb resolution. Because ORCA is compatible with RNA labeling in tissue, the user can use the data to investigate the relationship between chromatin structure and gene expression. These are some, not all, of the following ways the user can analyze the data: b, Single-cell distance maps from 5 individual cells, showing pairwise distances between labeled barcodes of the BX-C. c, c′, Example of two 3D traces of the BX-C chromatin path from single cells. The spheres on the polymer represent the 3D positions of the labeled barcodes. The spheres were linked together to generate a 3D polymer. d, As described in our previously published work25, we annotated body segments based on morphology and RNA expression pattern. The average nascent RNA intensity for the BX-C genes in body segments T3, A2, A3, and A9 are plotted on the left. These values are normalized based on the body segment with the highest RNA expression. To the right, body segment distance maps show the pairwise distances between the labeled BX-C barcodes. All maps are normalized relative to cells from head segments as these anterior cells have a compacted chromatin structure with no obvious TAD boundary partitioning. e, Average population distance map from all cells in 12 embryos. f, Individual RNA transcripts for each BX-C gene (note, Abd-B has two isoforms) per cell.
