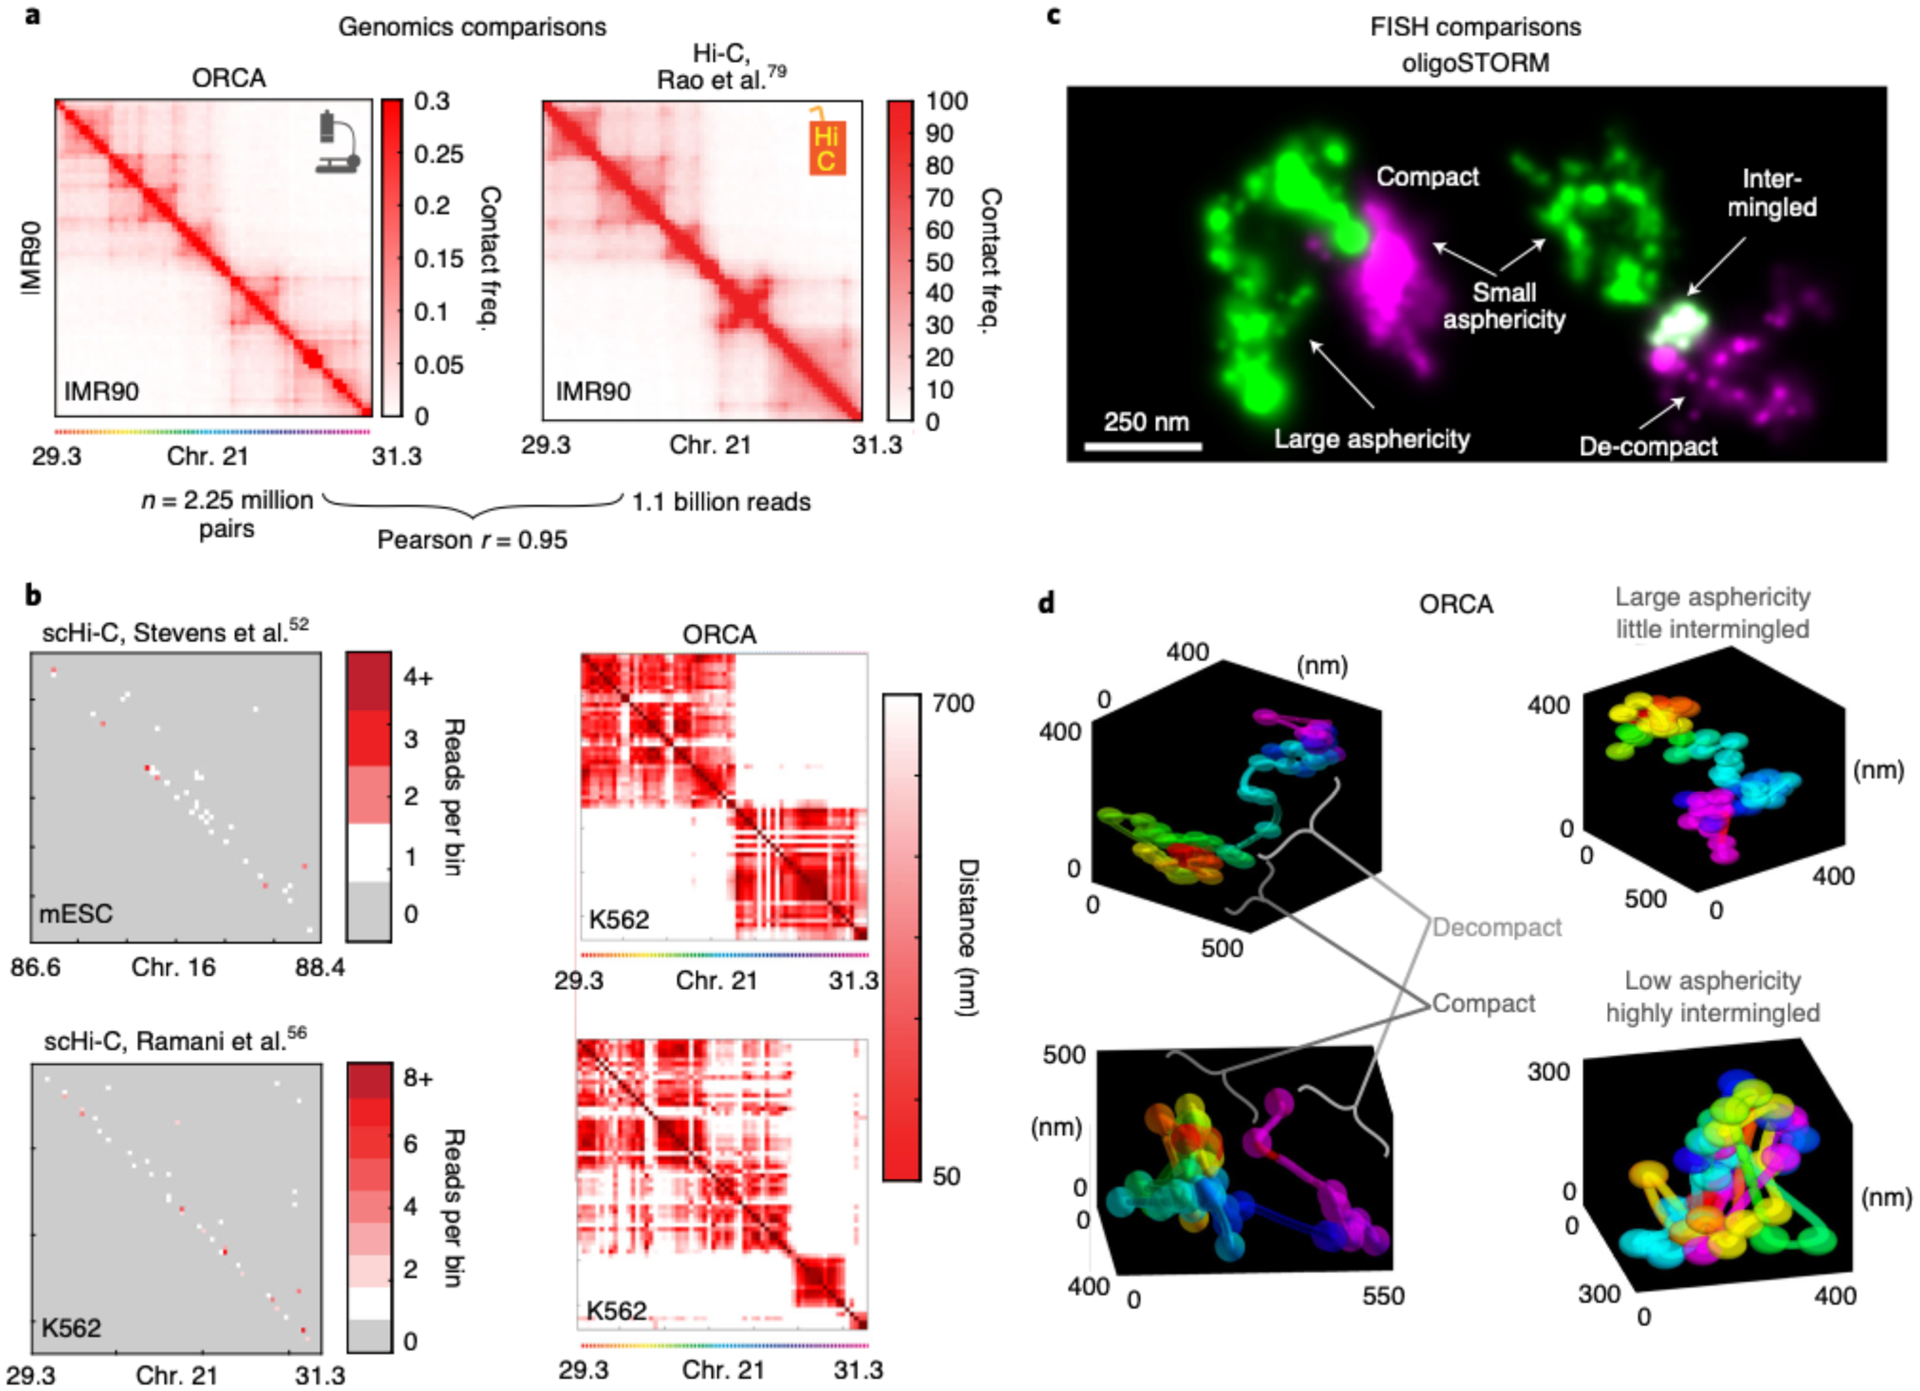
Fig. 3 |. Comparison between ORCA and other methods.

a, Comparison of ORCA generated average contact frequency map46 to a Hi-C generated map79, for a 2 Mb region from IMR90 human fibroblasts. b, Comparison of maps from individual cells imaged by ORCA46 or by single cell Hi-C52,56 for syntenic genomic intervals for the indicated cell lines. For the scHi-C data, the cell with the most total reads in the dataset is shown. Missed detection events are grey in the scHi-C maps and appear as white stripes in the ORCA maps. Please refer to Step 234 in the Troubleshooting table for potential reasons why these stripes are present in the single-cell ORCA distance maps. c, oligoSTORM resolves chromatin structural ‘shape properties’ below the diffraction limit, such as asphericity and compaction. (Left) 150 kb H3K4me2-rich chromatin (green) and ~150kb of adjacent H3K27me3 rich chromatin (magenta), (chr3R:12.65–12.95 Mb). (Right) Two adjacent regions of H3K4me2-rich chromatin in green and magenta (chr2R:19.7–19.9 Mb), images from Drosophila KC167 cells9. d, ORCA allows both the 3D features identified from STORM to be quantified and provides additional information about the path of the chromatin fiber. Examples are from BX-C (chr3R:12.5–12.8 Mb) in different cells of a Drosophila embryo, which are part of our previously published data25.
