
Figure 4.
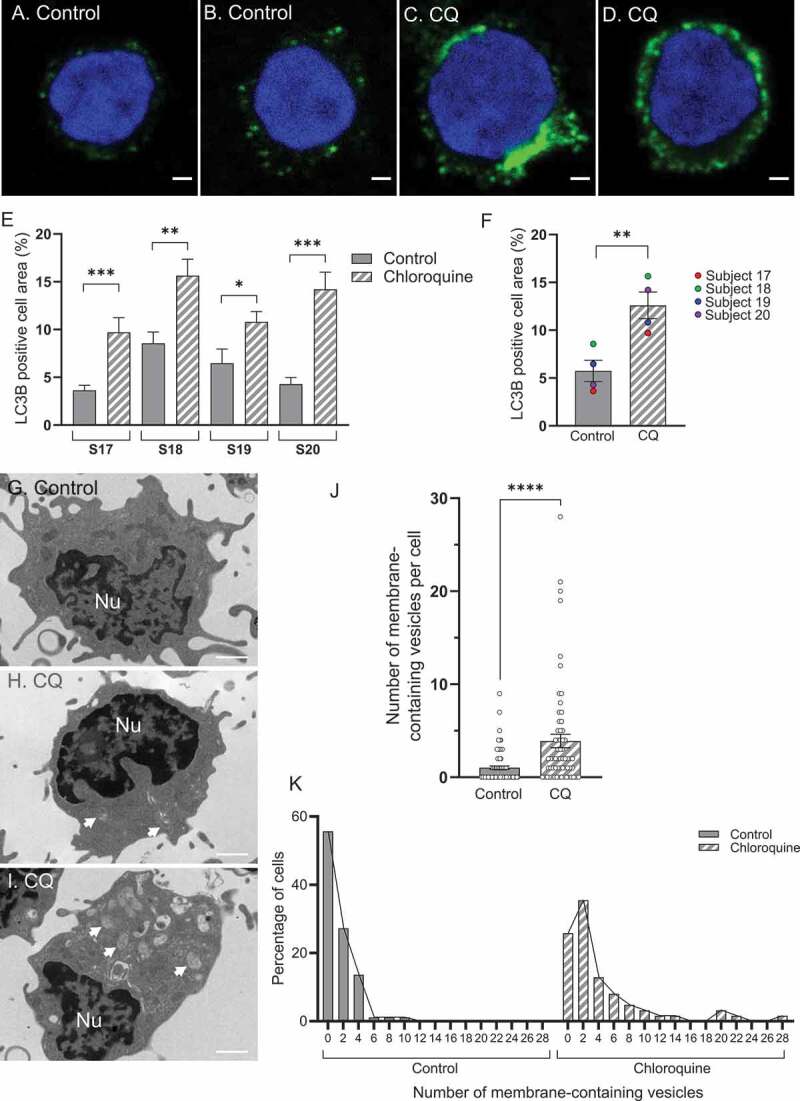
Image-based analysis shows an increase in autophagic vesicles after addition of CQ to whole blood. (A-B) Representative immunofluorescent staining for LC3B in lymphocytes from whole blood samples untreated or (C-D) treated with 150 µM CQ for one h. (E) Immunofluorescent staining quantification for LC3B is displayed for four different subjects and showed an increase in LC3B-positive cell area in CQ treated samples (p = 0.0010; Mann-Whitney; subject 17; p = 0.0072, 0.0334 and 0.0001 for subjects 18, 19 and 20 respectively; Unpaired t-test; N = 6–10 cells per condition). (F) LC3B-positive cell area increases in lymphocytes treated with CQ versus untreated controls (p = 0.0099; paired t-test; N = 4 subjects). (G) Transmission electron microscopy images of PBMCs for untreated control blood showing no vesicles (median control group = 0 vesicles), and for (H-I) CQ-treated blood samples (H: median CQ group = 2 vesicles; I: cell with high number of vesicles). Arrows pointing at membrane-containing vesicles. (J) The number of membrane-containing vesicles, quantified as autophagosomes, increased in PBMCs from CQ-treated blood samples compared to untreated samples (p < 0.0001; Mann-Whitney test; n = 88 control cells, n = 62 cells from whole blood treated with CQ pooled from 3 subjects). (K) Distribution of the number of vesicles per cell as percentage of cells for the same data presented in J. * p < 0.05, ** p < 0.01, *** p < 0.001, **** p < 0.0001. Error bars are SEM. Scale bars = 1 µm. Nu: nucleus. S: subject