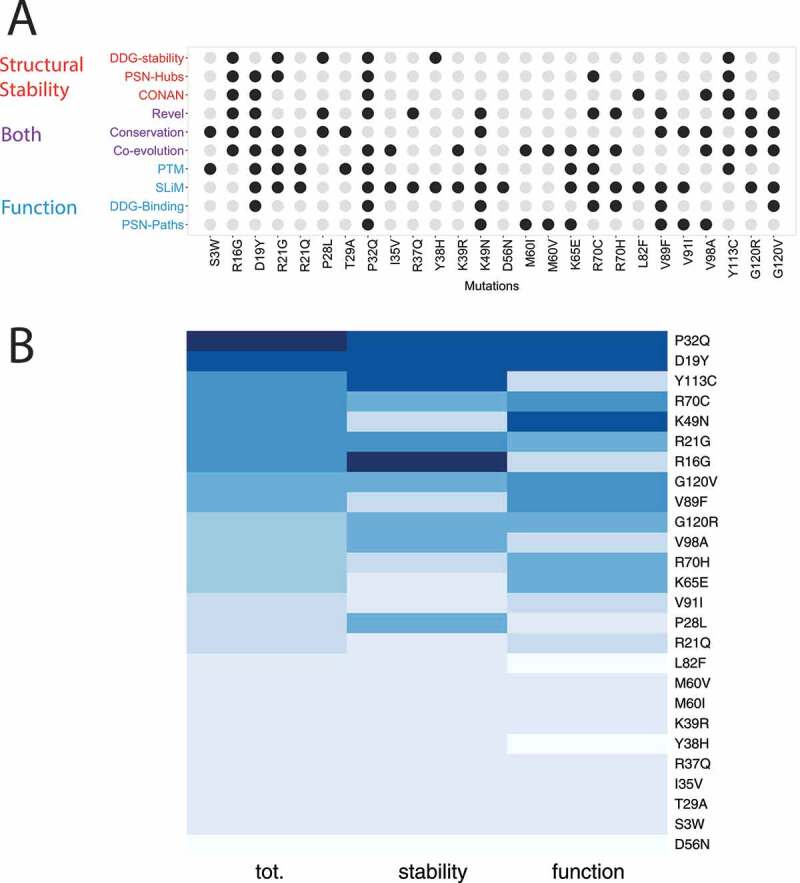
Figure 8.

Classification of LC3B mutations found in cancer genomic studies. (A) The different analyses carried out in our study have been aggregated to associate the potential of damaging (driver) or neutral (passenger) effect of each mutation. We used descriptors that account for protein stability (red), function (blue) or implicitly for both (purple). Mutations altering one of these properties are highlighted as black dots. The diagram in panel A allow to link each mutation to a specific effect which could guide the selection of the best set up for experimental validation and further studies. (B) The heatmap is the results of a ranking on a collective score of damaging potential for the mutation (first column). The results for the ranking only according stability and function is showed as a reference in the second and third column of the heatmap. Darker the color more damaging the mutation is
