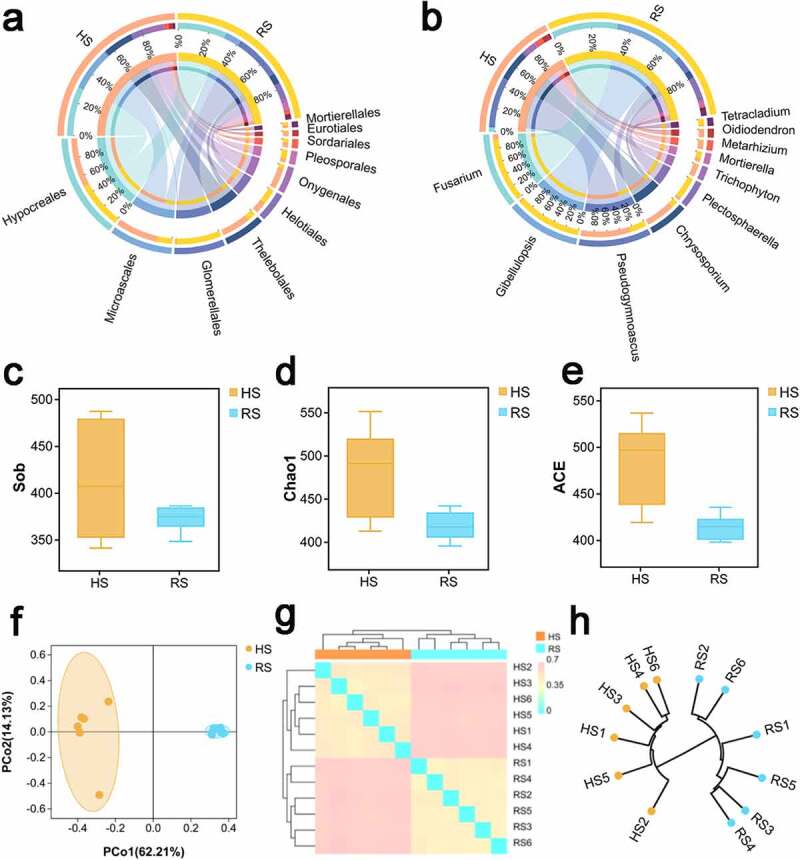
Figure 2.

The microbial community composition and diversity in HS and RS soil of American ginseng (a) Distribution of bacterial community for each group at the order level were visualized by Circos. (b) Distribution of bacterial community for each group at the genus level were visualized by Circos. The upper half circle indicates the species composition in each group: the color of the outer ribbon represents different groups; the color of the inner ribbon represents the composition of different species in group, and the length of the ribbon represents the relative abundance of the corresponding species. The lower half circle indicates the distribution ratio of species in different group at the genus level: the outer ribbon represents the genus; the inner color of the ribbon represents different groups, and the length represents the proportion of the sample for a particular genus.α-diversity:(c)Sob;(d)Chao1;(e)ACE.β-diversity:(f)PCoA plot based on the unweighted UniFrac distance matrix.(g) Heat map on the basis of Bray-Curtis distance matrix. (h) Cluster Dendrogram based on Jaccard distance. HS: healthy root; RS: rot root
