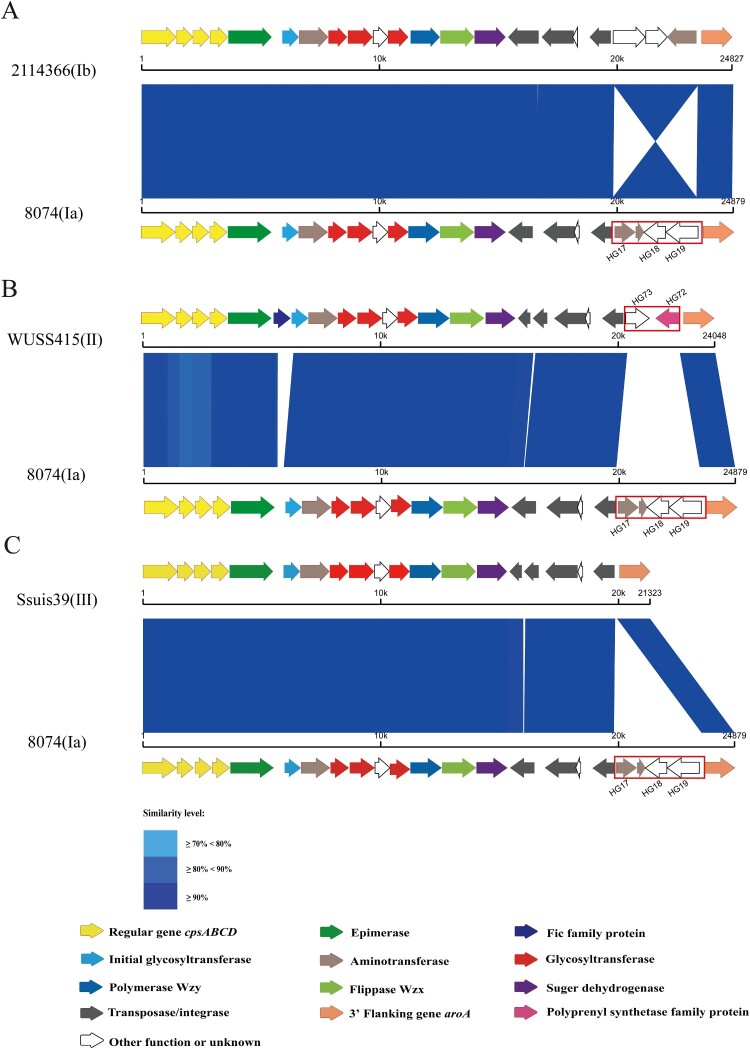
Figure 3.
The schematic comparison of the cps gene cluster subtype Ia to that of Ib (A), II (B), and III (C). Each colored arrow represents the gene whose predicted function is shown in the blow panel. HG17, HG18, HG19, HG72, and HG73 genes are indicated. The aroA gene is located on the 3′ side of each locus. Regions of over 70% identity were marked by blue shading.

