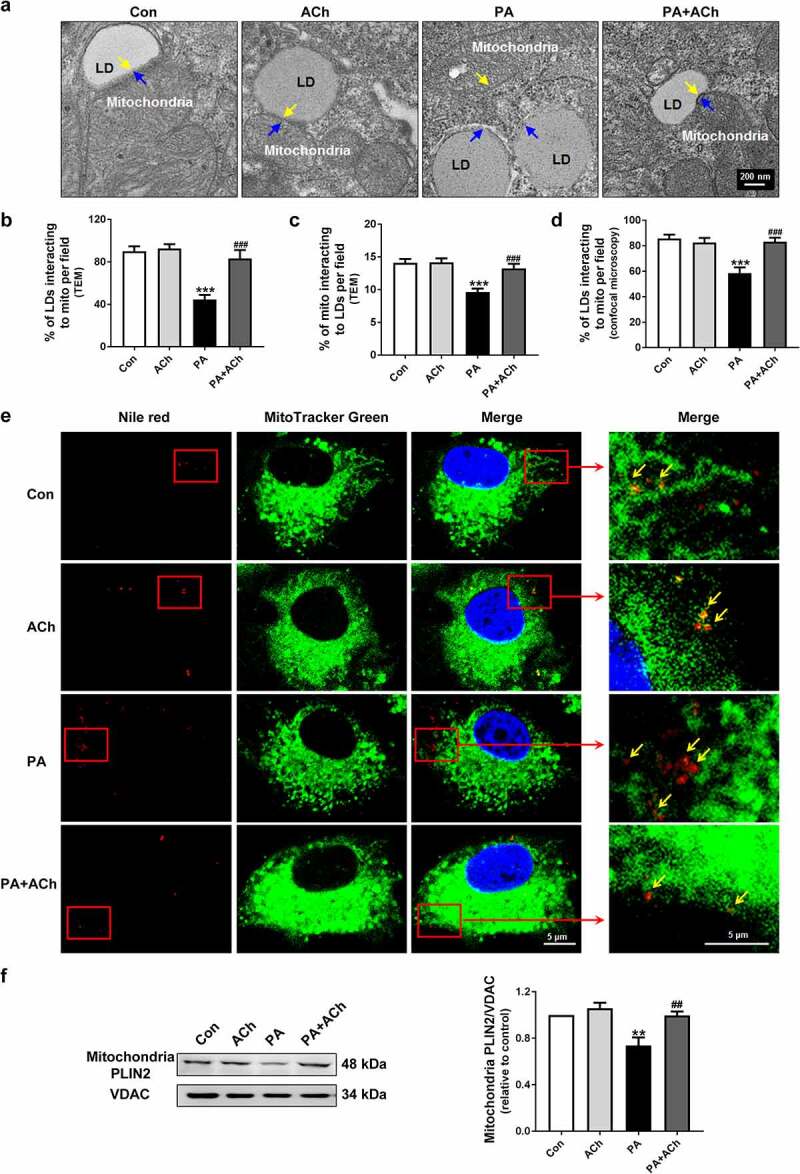
Figure 4.

ACh reversed the PA-induced LD-mitochondria interaction. (a) Representative TEM images of NRVCs. Yellow arrows indicate individual mitochondria, and blue arrows indicate LDs. Scale bar, 200 nm. LD-mitochondria interactions in TEM images were evaluated by measuring (b) the ratio of LDs that directly contacted mitochondria to the total number of LDs, and (c) the ratio of mitochondria that directly contacted LDs to the total number of mitochondria. The experiments were repeated four times with cells obtained from four independent cultures, and static fluorescence images of four visual fields were analyzed for each sample. (d) LD-mitochondria interactions in confocal images (e) were evaluated by measuring the ratio of LDs that directly contacted mitochondria to the total number of LDs. The experiments were repeated four times with cells obtained from four independent cultures, and static fluorescence images of four visual fields were analyzed for each sample. (e) Confocal imaging of NRVCs. Scale bar, 5 μm. Cardiomyocytes were stained with Nile red (LDs, red), MitoTracker Green (mitochondria, green), and DAPI (nuclei, blue). Yellow arrows indicate LDs. (f) The effect of ACh on PLIN2 expression in mitochondrial fractions of PA-treated NRVCs; n = 6 independent experiments. **P < 0.01, ***P < 0.001 vs. Con; ##P < 0.01, ###P < 0.001 vs. PA. Mito, mitochondria
