
Figure 5.
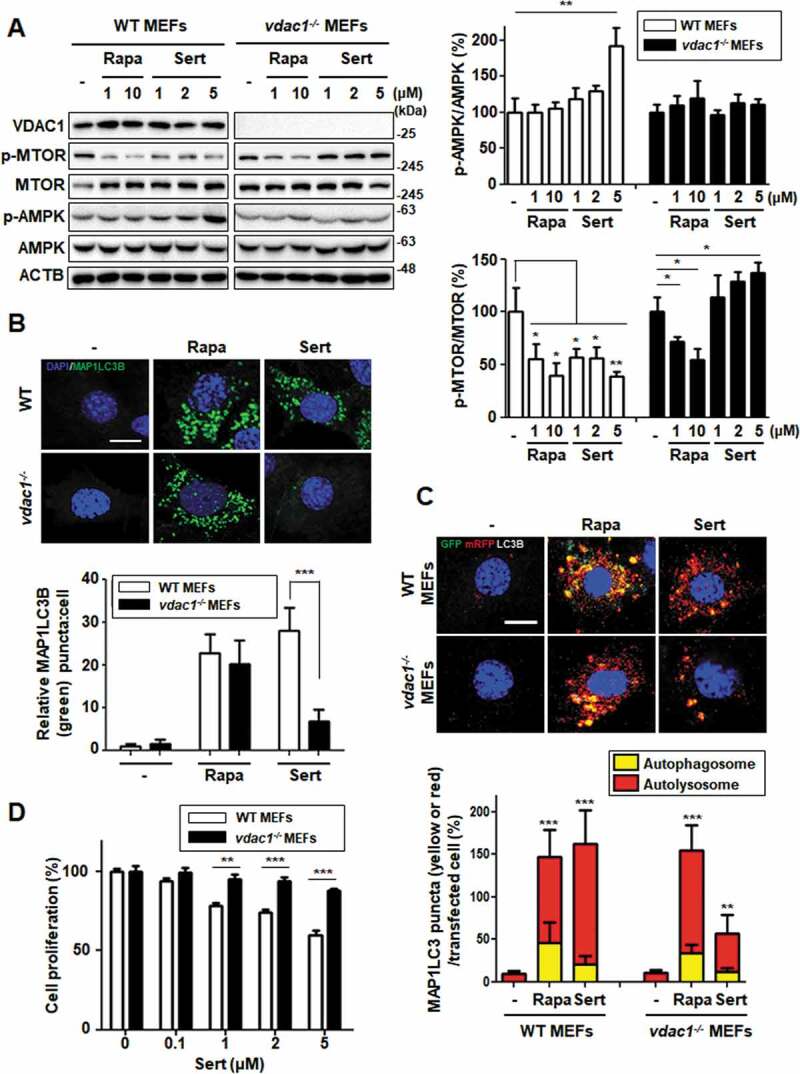
Biological validation using vdac1-knockout cells reveals that VDAC1 is a biological relevant protein target of Sert. (A) Western blot analysis of the levels of VDAC1, p-MTOR, MTOR, p-AMPK, AMPK, and ACTB in cells after each compound treatment for 30 min in WT MEFs or vdac1-knockout MEFs. The graph plots the quantification data is shown in (A). n = 3, *p < 0.05, **p < 0.01. (B) MAP1LC3 positive puncta (green) were increased by Sert (5 μM) treatment in WT MEFs, whereas vdac1-knockout MEFs treated with Sert did not induce autophagic vesicles formation. The cells were treated with Sert (5 μM) or Rapa (10 μM) for 24 h in HUVECs. And then, the cells were harvested, followed by treatment with MAP1LC3B (green) antibody for 1 h. Nuclei were stained with DAPI. Images were obtained from confocal microscopy. Quantification of data is shown in (B). Values are means ± SEM; n > 10 cells, ***p < 0.001; scale bar: 10 μm. (C) Autophagic flux evaluation in WT MEFs or vdac1-knockout MEFs using mCherry-GFP MAP1LC3 in the presence of each compound. Representative images of merged channels are shown; scale bar: 10 μm. Pearson coefficient for the colocalization analysis is shown. Quantification of data is shown in (C). Values are means ± SEM; n > 10 cells, **p < 0.01, ***p < 0.001. (D) Effect of Sert treatment on the proliferation of WT MEFs and vdac1-knockout MEFs. All cells were treated with Sert (0–5 μM) for 72 h, and cell growth was measured using an MTT colorimetric assay. N = 3, Values are means ± SEM. **p < 0.01, ***p < 0.001