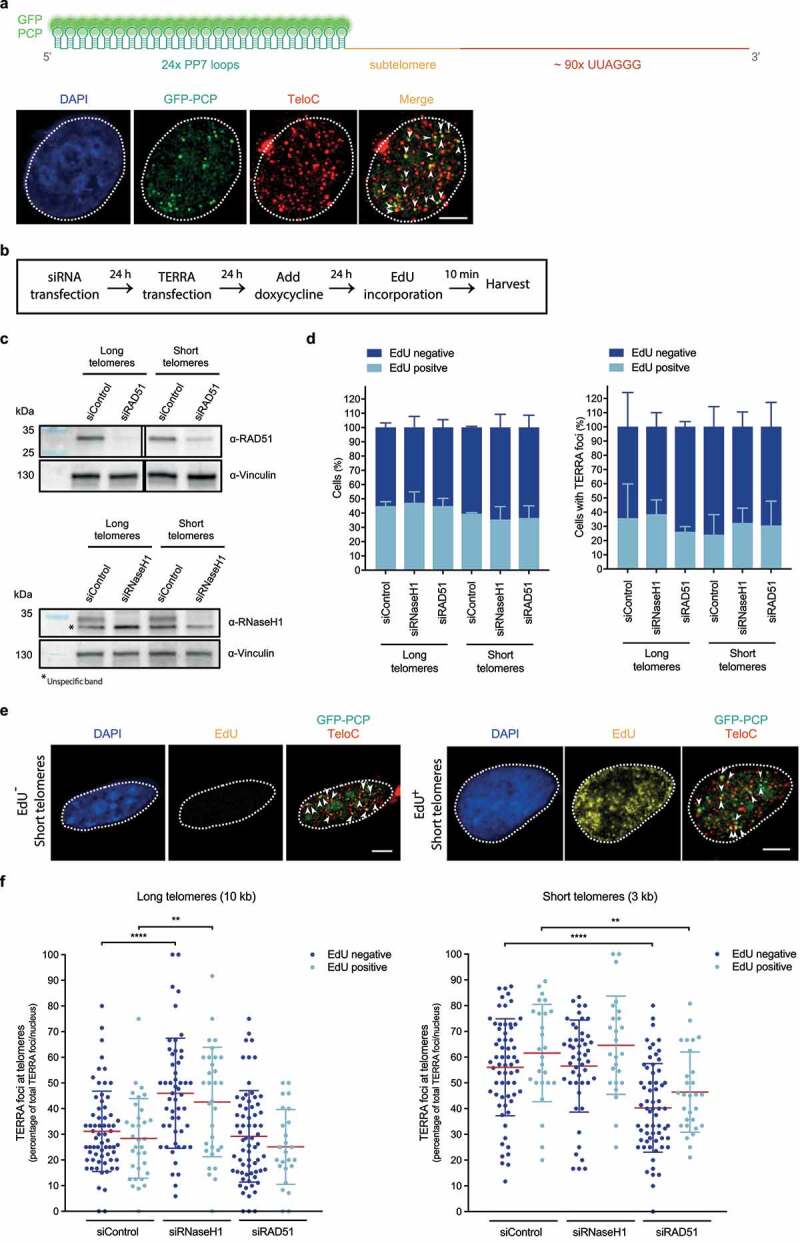
Figure 2.

Transgenic TERRA associates with telomeres in and outside S phase. a) Top: Depiction of transiently expressed chimeric TERRA, comprising twenty-four Pseudomonas aeruginosa phage 7 (PP7) stem-loops – recognized by GFP-tagged dimerized PP7 Coat Protein (PCP) –, and a subtelomere-derived sequence, followed by UUAGGG tandem repeats. Illustration created with BioRender.com. Bottom: Immunofluorescence of GFP (green) was employed to analyze co-localization of transiently expressed PP7-fused 15q-TERRA transcripts with telomeres (red) identified by Fluorescence in situ hybridization (FISH) (as described in ref 34). Representative images are shown and were acquired with a Leica SP8 confocal microscope. White dashed line outlines the nuclear region and was determined based on DAPI-staining. White arrowheads indicate co-localization of GFP-PCP with telomeric FISH signals. Scale bar indicates 5 μm. b) HeLa cells with long (10 kilobase average) or short (3 kb average) telomeres were transfected with siRNA pools to down-regulate RAD51 or RNase H1 mRNA levels. PP7-15q-TERRA-coding constructs were transfected and their expression was induced with doxycycline for 24 hours. Cells were then pulse-labeled with 10 μM of 5-ethynyl-2ʹ-deoxyuridine (EdU) (Invitrogen) for 10 min and harvested. c) Western blotting was used to evaluate knockdown efficiency of RAD51 (top) or RNase H1 (bottom). Vinculin is shown as a loading control. Representative blots of three biologically-independent experiments are shown. d) Percentage of EdU-positive cells in the total population of cells (left) or cells displaying TERRA foci (right), across indicated conditions. After EdU pulse-labeling, cells were fixed in 4% paraformaldehyde for 10 min at room temperature. Anti-GFP immunofluorescence was performed as described in ref 34. After fixation of bound primary and secondary antibodies, cells were permeabilized with a detergent solution (0.1% Triton X-100, 0.02% SDS in 1x PBS) for 5 min, followed by pre-blocking with 2% bovine serum albumin (BSA) in 1x PBS for 30 min. Cells were then incubated with a click-it reaction (4 mM copper sulfate, 100 mM sodium ascorbate and 4 μM Alexa Fluor 488 Azide (Invitrogen) in 1x PBS) for 30 min in a humidity-chamber, followed by three 1x PBS washes, permeabilization with a detergent solution (indicated above) for 3 min and 4% paraformaldehyde fixation for 5 min. FISH staining was then carried out following the procedure described in ref 34. At least 460 total cells and 74 cells displaying TERRA foci were analyzed per condition, across three independent biological replicates. Data are means ± s.d. e) Representative images of EdU-negative (left) and EdU-positive (right) HeLa cells with short telomeres, obtained as described in d. Representative images were acquired with a Leica SP8 confocal microscope. White dashed line outlines the nuclear region and was determined based on DAPI-staining. EdU signal is shown, as well as GFP-PCP and TeloC merged signals. White arrowheads indicate co-localization of GFP-PCP with telomeric FISH signals. Scale bars indicate 5 μm. f) The percentage of PP7-15q-TERRA foci colocalizing with telomeric FISH signals per nucleus was assessed by GFP immunofluorescence, EdU Click-it and telomeric FISH as described in d. At least 74 cells were analyzed per condition, across three independent biological replicates. Data are means ± s.d. One-way analysis of variance (ANOVA) with Dunnett’s multiple comparisons test was used, comparing all conditions with non-targeting siRNA (siControl): **P < 0.01; ****P < 0.0001. All statistical analysis was performed using GraphPad Prism. All images were processed and analyzed with Image J
