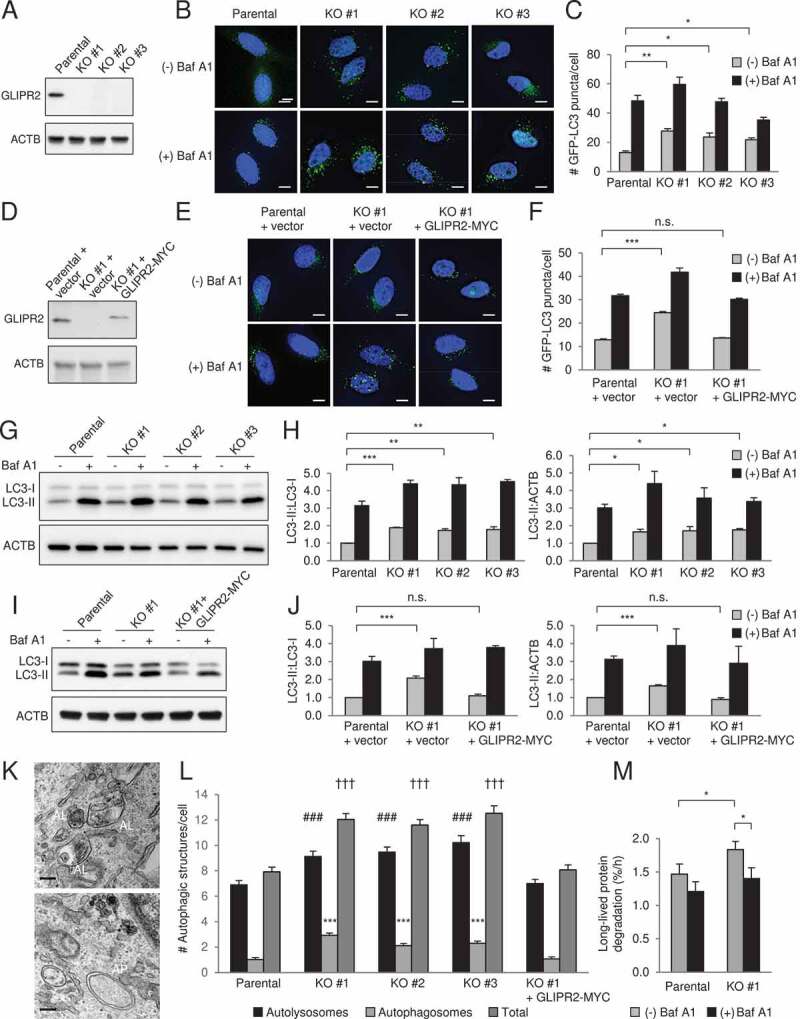
Figure 1.

GLIPR2 knockout cells have increased autophagic flux. (A) Western blot analysis of GLIPR2 expression in HeLa parental cells and HeLa CRISPR-Cas9-mediated GLIPR2 knockout (KO) cells. Clones #1-3 are from three independent targeting experiments. (B and C) Representative images (B) and quantification (C) of GFP-LC3 puncta in HeLa parental and GLIPR2 KO cells ± 50 nM Baf A1 for 2 h. Bars represent mean ± SEM of triplicate samples (30–70 cells analyzed per sample). Scale bars: 10 µm. Similar results were observed in four independent experiments. n.s., not significant, *p < 0.05, **p < 0.01; one-way ANOVA with Dunnett’s test for multiple comparisons. (D) Western blot analysis of GLIPR2 expression in HeLa parental cells, HeLa GLIPR2 KO clone #1 and HeLa GLIPR2 KO clone #1 reconstituted with GLIPR2-MYC. (E and F) Representative images (E) and quantification (F) of GFP-LC3 puncta in HeLa parental cells, HeLa GLIPR2 KO clone #1 and GLIPR2 KO clone #1 reconstituted with wild-type GLIPR2-MYC ± 50 nM Baf A1 for 2 h. Bars represent mean ± SEM of triplicate samples (30–70 cells analyzed per sample). Scale bars: 10 µm. Similar results were observed in four independent experiments. n.s., not significant, ***p < 0.001; one-way ANOVA with Dunnett’s test for multiple comparisons. (G and H) Representative western blots (G) of endogenous LC3 in indicated cell lines cultured in the absence or presence of 100 nM Baf A1 for 2 h. Similar results were observed in three independent experiments and the relative quantification (H) of LC3-II to LC3-I and LC3-II to ACTB/actin. Bars represent mean ± SEM. *p < 0.05, **p < 0.01, ***p < 0.001; one-way ANOVA with Dunnett’s test for multiple comparisons. (I and J) Representative western blots (I) of endogenous LC3 in indicated cell lines cultured in the absence or presence of 100 nM Baf A1 for 2 h. Similar results were observed in three independent experiments and the relative quantification (J) of LC3-II to LC3-I and LC3-II to ACTB/actin. Bars represent mean ± SEM. n.s., not significant, ***p < 0.001; one-way ANOVA with Dunnett’s test for multiple comparisons. (K and L) Representative images of autolysosomes (AL) and autophagosomes (AP) in GLIPR2 KO cells (K) and quantification (L) of autolysosomes and autophagosomes in indicated cell lines. Bars represent mean ± SEM (40 cells per sample). For autolysosomes, ###, p < 0.001; for autophagosomes, ***p < 0.001; for total autophagic structures, †††p < 0.001; one-way ANOVA with Dunnett’s test for multiple comparisons. Scale bars: 200 nm. (M) The degradation rate of long-lived proteins in indicated cells in the absence or presence of 50 nM Baf A1 was calculated from six independent experiments. Bars represent mean ± SEM. *p < 0.05; paired, two-tailed t-test
