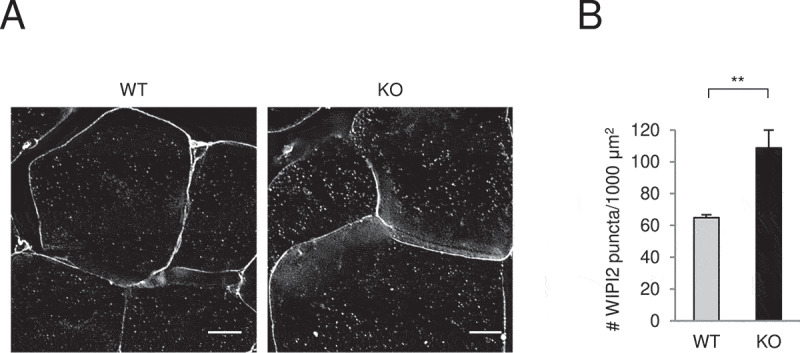
Figure 6.

Glipr2 KO mouse muscles have increased WIPI2 puncta. (A and B) Representative images (A) and quantification (B) of WIPI2 puncta in skeletal muscles from Glipr2+/+ (WT) and glipr2-/- (KO) mice. Bars represent mean ± SEM (4 mice per group, 20 randomly chosen fields per mouse). Scale bars, 10 μm. **p < 0.01; unpaired, two-tailed t-test
