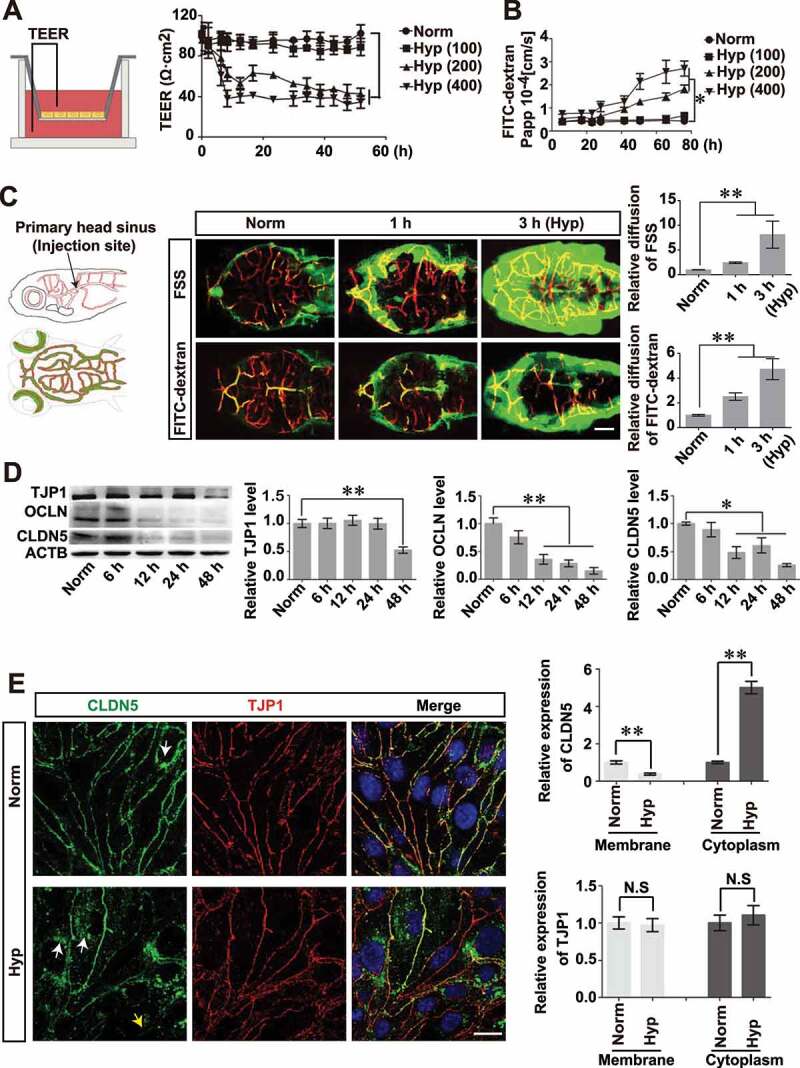
Figure 2.

Hypoxia treatment results in impairment of BBB. (A and B) After the formation of a monolayer of bEnd.3 on transwell membrane, the barrier function was reduced under CoCl2-induced hypoxia condition, as evaluated by the TEER and the infiltrated FITC-dextran (10 kDa) measurement. Hyp (100), Hyp (200) and Hyp (400) indicate hypoxia induction by CoCl2 with a concentration of 100, 200, 400 μmol/L, respectively. (C) Cerebral microangiograph on 5 dpf zebrafish to evaluate the BBB permeability after hypoxia induction. After injection of FSS (735 Da) or FITC-dextran (70 kDa) into the primary head sinus (schematic diagrams on the left), reconstructed 3-dimensional cerebrovascular images showed severe infiltration of the dye penetrant through BBB after N2-induced hypoxic treatment for 1 or 3 h (middle and right). Tg(kdrl:ras-cherry)s916 transgenic zebrafish in which vascular endothelial cells were labeled by cherry fluorescent protein was used. n = 12 fishes per group. Scale bar: 100 μm. (D) A reduced expression of TJ proteins including TJP1, OCLN and CLDN5 was detected in monolayer bEnd.3 cells after 200 μmol/L CoCl2 induction with a time-dependent manner (0, 6, 12, 24 and 48 h). n = 3 repeats. P value indicates one-way ANOVA with Dunnett’s multiple comparisons test. (E) TJ proteins, especially CLDN5, delocalized from membrane (yellow arrow) and aggregated in the cytosol (white arrows) of bEnd.3 after 200 μmol/L CoCl2-induced hypoxia treatment for 12 h. The integrated optical density (IOD) of the cytosolic proteins was quantified. n = 3. P value indicates two-tailed unpaired t test. Scale bar: 10 μm. TEER: trans-endothelial electrical resistance; Norm: normoxia; Hyp: hypoxia; FSS: fluorescein sodium salt; FITC-dextran: fluorescein-labeled dextran; Papp: apparent permeability coefficient. Data were presented as mean ± SEM. *, P < 0.05; **, P < 0.01
