
Figure 3.
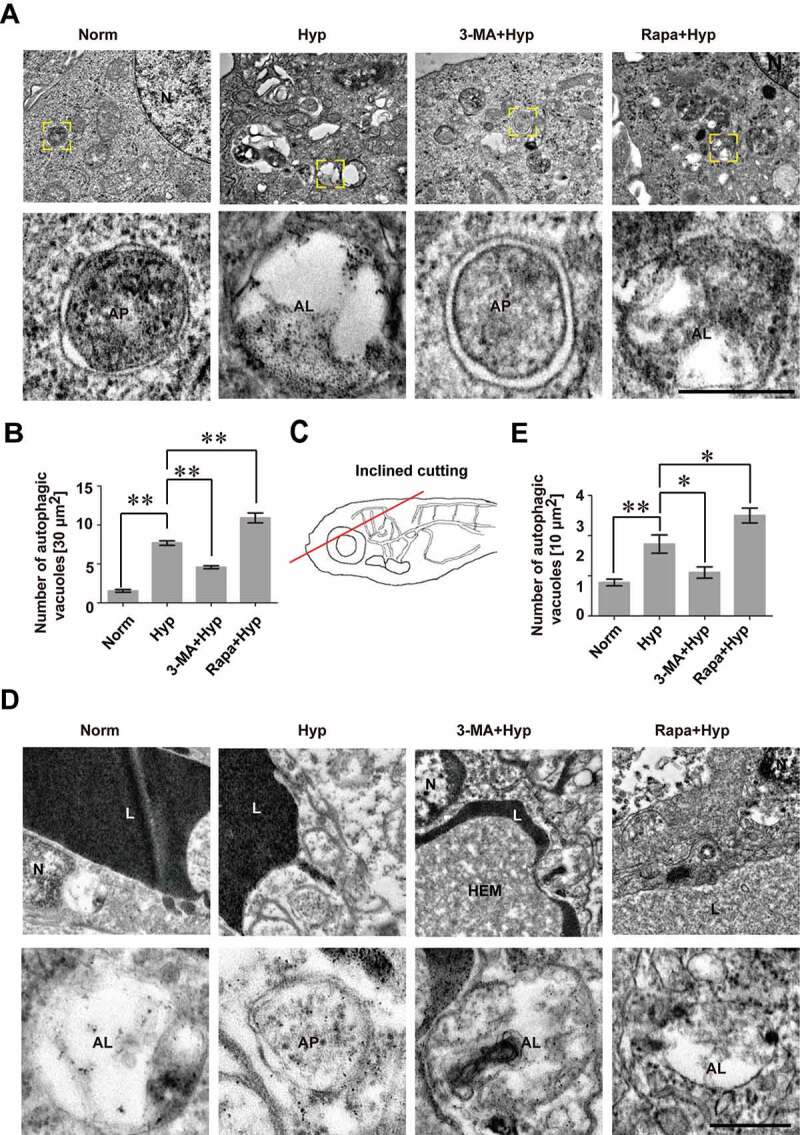
An increase of autophagosomes and autolysosomes in cerebrovascular endothelial cells after hypoxia induction. (A and B) Hypoxia induction caused an increase of autophagosomes and autolysosomes while blockage of autophagy by 3-MA inhibited the formation of autophagosomes in bEnd.3 cells (yellow arrowheads), as imaged by TEM. Conversely, activation of autophagy by Rapa treatment increased the number of autophagosomes (yellow arrowheads). The lower panel show high magnification of yellow square-labeled area in the up panel. Autophagic vacuoles were counted quantified from a 30 μm2-sized region per cell. n = 5. (C) BMECs of zebrafish embryos were scanned by TEM after cross section of the brain region (red line in the schematic diagram) and autophagosomes in BMECs of zebrafish post 1 h-hypoxia treatment were captured (D). The lower panel show high magnification scans of the area labeled by yellow squares in the upper panel. (E) Hypoxia treatment caused an increase of autophagosomes in BMECs of zebrafish while 3-MA inhibits the formation of autophagic vacuoles. In contrast, Rapa treatment increased the number of autophagosomes in hypoxia-induced zebrafish BMECs. Autophagic vacuoles were quantified in 10 μm2-sized region per endothelial cell. Yellow arrowheads indicate autophagosomes. n = 4 fishes per group. Data were presented as mean±SEM. P value indicates one-way ANOVA with Dunnett’s multiple comparisons test. *, P < 0.05; **, P < 0.01. Norm: normoxia; Hyp: hypoxia; CoCl2: 200 μmol/L, treated for 12 h; CQ: Chloroquine, 30 μmol/L; 3-MA: 3-methyladenine, 10 mmol/L; Rapa: rapamycin, 50 nmol/L; L: cerebrovascular lumen; AP, autophagosome; AL, autolysosome; HEM, hematocyte. Scale bars: 1 μm