Figure 5.

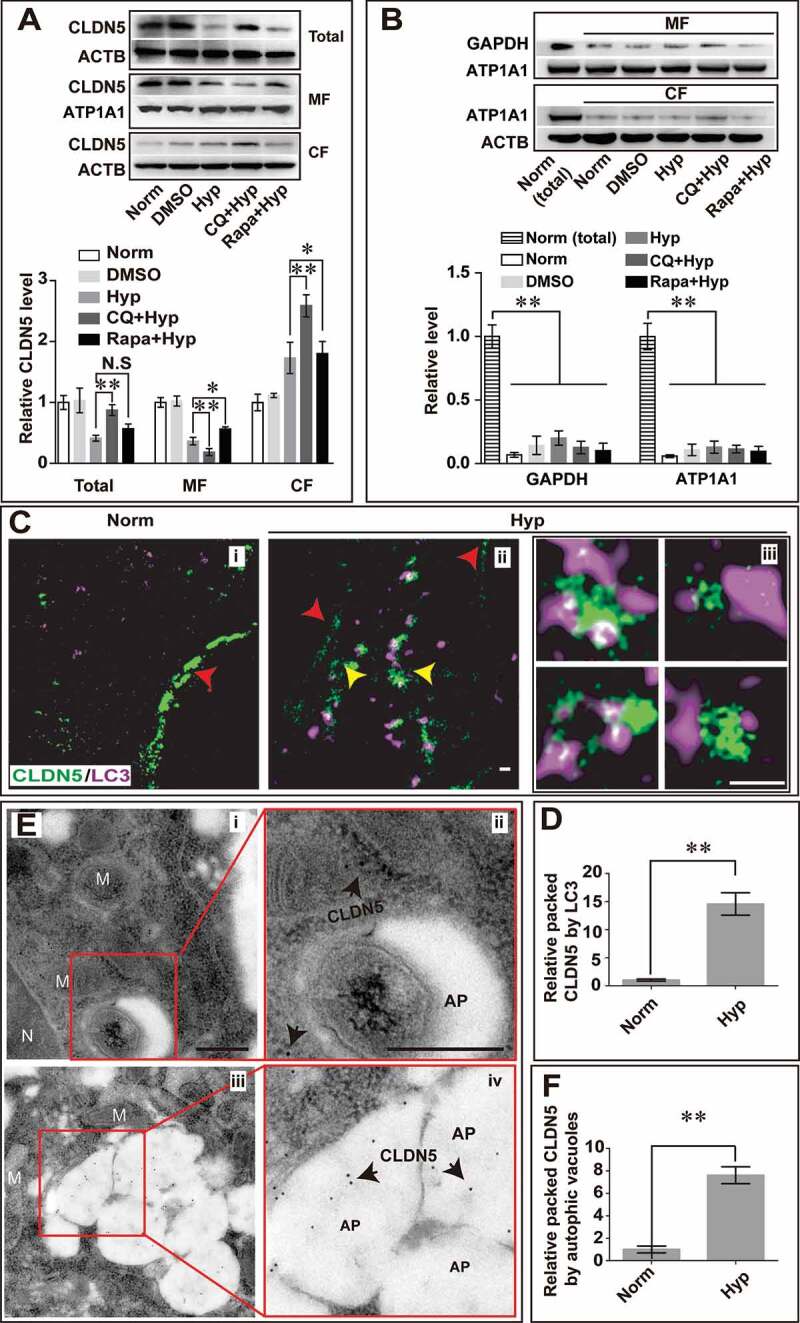
Autophagy mediates the degradation of endothelial CLDN5 in the cytosol. (A) After hypoxia treatment, the membranous, cytosolic and total CLDN5 in bEnd.3 cell was quantified by western blot analyses. Blockage of autophagy by CQ caused an accumulation of CLDN5 in the cytosol while Rapa-induction partly retarded the redistribution of membranous CLDN5. (B) Western blotting analyses showed a high protein purity of cytosolic or membranous fractions under different induction conditions. GAPDH was used as cytosolic reference marker and ATP1A1/Na,K-ATPase was used as membranous reference marker. n = 3 repeats. Data were presented as mean ± SEM. P value indicates one-way ANOVA with Dunnett’s multiple comparisons test. (C and D) Stimulated emission depletion (STED) microscope images showed that after the hypoxia induction, membranous CLDN5 (red arrowheads in i and ii) delocalized, aggregated and was surrounded by LC3 in the cytosol (yellow arrowheads in ii). iii are high magnification images of the cytosolic proteins in ii. The numbers of LC3-surrounded CLDN5 clusters per image were counted and quantified. (E and F) Immuno-electronmicroscope (IEM) images showed CLDN5 (black arrows) was packaged in autophagosome-like vesicles in bEnd.3 cells after CoCl2-induced hypoxia treatment. i and ii, normoxia control; iii and iv, hypoxia-treated group. ii and iv are high magnification scans of the red line-marked regions in i and iii respectively. The numbers of gold particles in autophagosome-like vesicles were quantified. P value indicates two-tailed unpaired t test. MF: membranous fraction; CF: cytosolic fraction. M, mitochondria; N, nucleus, AP, autophagosome; CQ: Chloroquine, 30 μmol/L; Rapa: rapamycin, 50 nmol/L. Data were presented as mean ± SEM. n = 3. *, P < 0.05; **, P < 0.01. N.S: no significance. Scale bars: 500 nm
