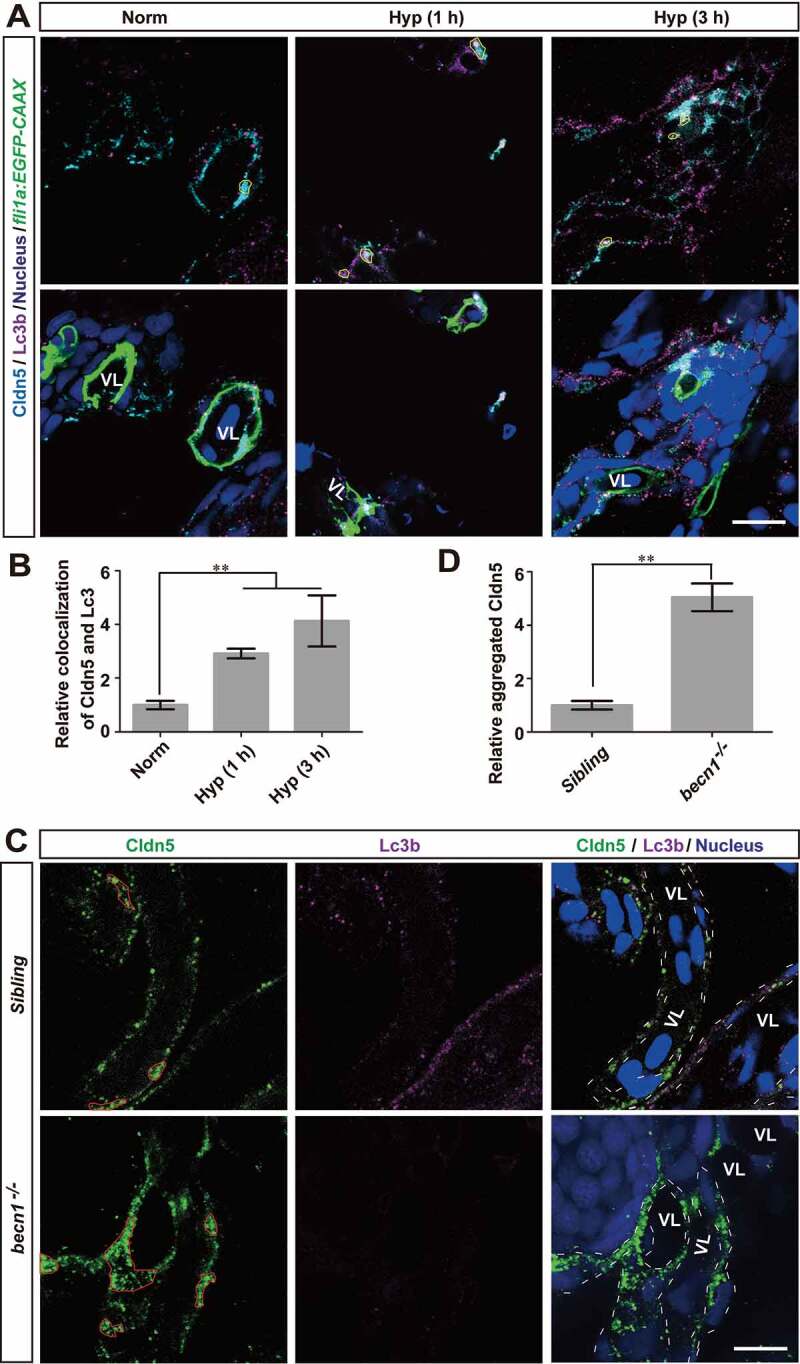
Figure 6.

Autophagy suppresses the redistribution of membranous Cldn5 in zebrafish cerebrovascular endothelial cells. (A and B) Colocalization of Lc3b and Cldn5 (yellow circles) was observed in the cytosol of zebrafish BMECs after N2-induced hypoxia for 1 or 3 h respectively. Endothelial eGFP-specific transgenic Tg(fli1a:EGFP-CAAX) zebrafish (5 dpf) were used. The integrated optical density (IOD) of colocalized Lc3b and Cldn5 in the cytosol of zebrafish cerebrovascular endothelial cells (in yellow circles) was quantified. n = 4 fishes per group. P value indicates one-way ANOVA with Dunnett’s multiple comparisons test. (C and D) Autophagy deficiency caused a cytosolic accumulation of Cldn5 (red circles) in the BMECs of homozygous becn1 mutated zebrafish, especially in the perinuclear space, after N2-induced hypoxia treatment for 1 h. IOD of colocalized Lc3b and Cldn5 in the cytosol of zebrafish cerebrovascular endothelial cells (in red circles) was quantified. n = 4 fishes for each group. P value indicates two-tailed unpaired t test. **, P < 0.01. Norm: normoxia; Hyp: hypoxia; VL: cerebrovascular lumen. LC3: microtubule-associated protein 1 light chain 3; 3-MA: 3-methyladenine, 10 mmol/L; CQ: chloroquine, 30 μmol/L; Rapa: rapamycin, 50 nmol/L. Yellow circles indicate the colocalization of LC3 and Cldn5 in the cytosol of BMECs and white dotted lines indicate the boundary of BMECs of zebrafish. Scale bars: 5 μm
