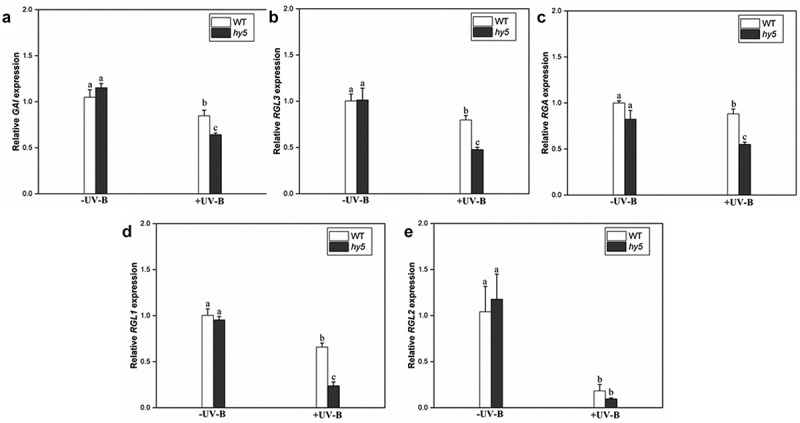
Figure 6.

Transcript levels of DELLA genes in wild-type WT and hy5-215 mutant quantified by qRT-PCR
Seedlings were grown in white light for 7 d and exposed to ±UV-B for 4 h. Relative expression levels of (a) GAI gene; (B) RGL3 gene; (c) RGA gene; (d) RGL1 gene; and (e) RGL2 gene. Error bars represent the standard error (SE) of the mean of three biological replicates. Different lowercase letters indicate statistically significant differences between the gene transcript levels (Tukey’s test; P < 0.05).
