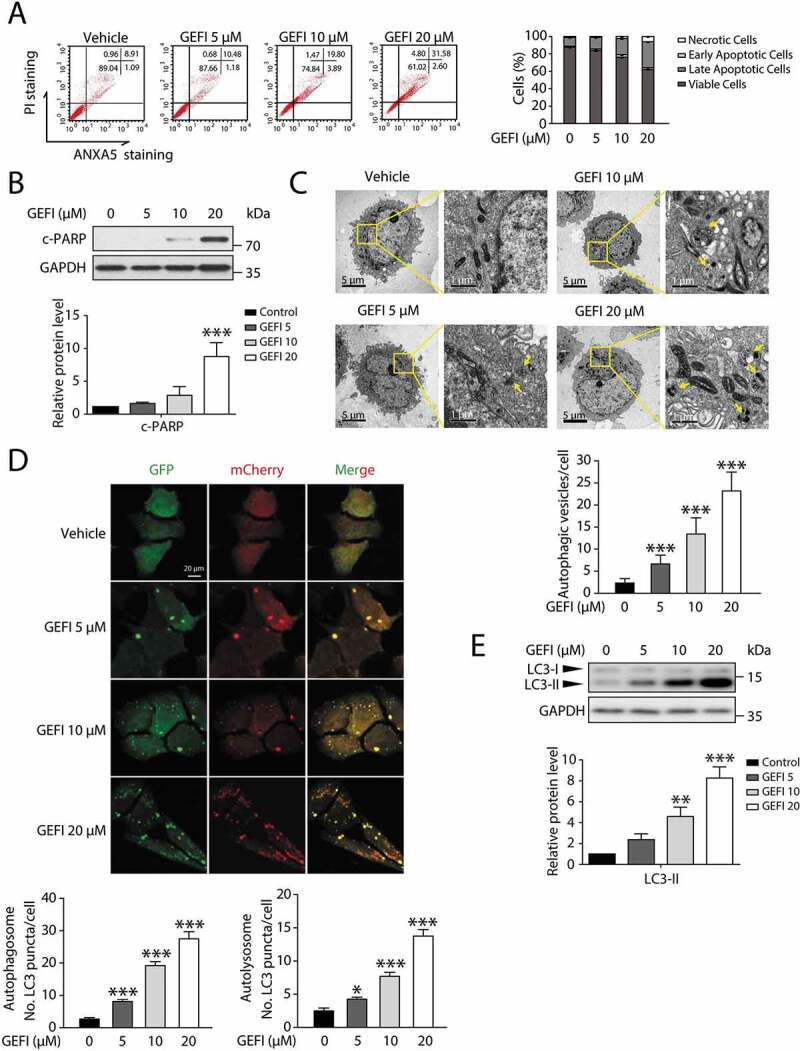
Figure 1.

Gefitinib activates hepatocytes apoptosis and autophagy. (A) HL-7702 cells were treated for 48 h as indicated. Apoptotic cells were identified by flow cytometry (n = 3). (B–E) HL-7702 cells were treated with gefitinib as indicated for 24 h. (B) Expression of c-PARP was analyzed by western blot. (C) Representative images of transmission electron microscope. For 1750× magnification, scale bar: 5 µm; for 10000× magnification, scale bar: 1 µm. Yellow arrowheads denote autolysosomes. Autophagic vesicles (autophagosome/autolysosome) per cell were quantified (n > 20, one-way ANOVA, Dunnett T3 test). (D) Representative confocal fluorescence micrographs of HL-7702 cells transfected with Ad-mCherry-GFP-LC3B. Scale bar: 20 μ. Quantification of autophagosome and autolysosome puncta was represented (n > 30, one-way ANOVA, Dunnett T3 test). (E) Expression of LC3 was analyzed by western blot. Western blot was repeated at least three times and densitometric analysis was carried out. All data are presented as the mean ± SD. *p < 0.05; **p< 0.01; ***p< 0.001. Abbreviations: GEFI, gefitinib; c-PARP, cleaved PARP
