Figure 2.

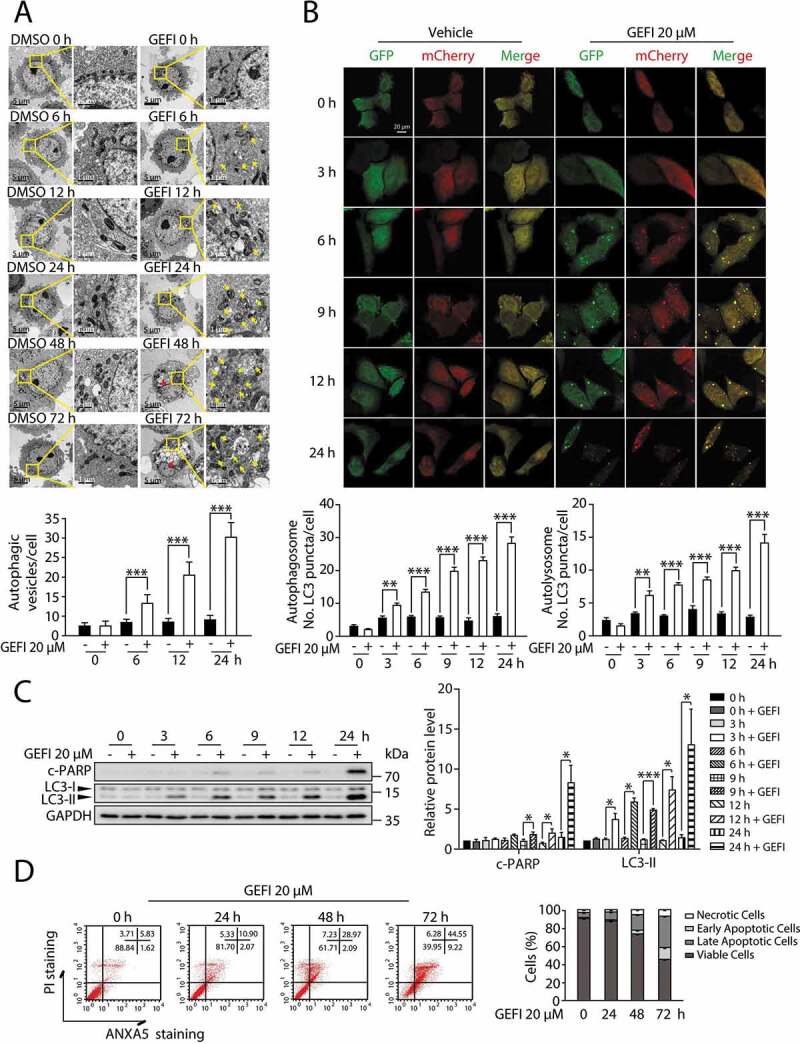
Autophagy and apoptosis activated by gefitinib are in sequence. (A) Representative electron micrographs of HL-7702 cells from different time period with DMSO or 20 µM gefitinib treatment. For 1750× magnification, scale bar: 5 µm; for 10000× magnification, scale bar: 1 µm. Yellow arrowheads indicate autolysosomes. Red arrowheads indicated the condensation of nucleus. Autophagic vesicles were quantified (n > 20, Student´s t-test). (B) Representative confocal fluorescence micrographs of HL-7702 cells transfected with Ad-mCherry-GFP-LC3B under gefitinib treatment. Scale bar: 20 μ. Quantification of autophagosome and autolysosome puncta was represented (n > 30, Student´s t-test). (C) HL-7702 cells were treated with 20 µM gefitinib at indicated time periods. Expressions of c-PARP and LC3 were analyzed by western blot. (D) HL-7702 cells were treated with 20 µM gefitinib as indicated. Apoptotic cells were identified by flow cytometry (n = 3). Western blot was repeated at least three times and densitometric analysis was carried out. All data are presented as the mean ± SD. *p < 0.05; **p < 0.01; ***p < 0.001. Abbreviations: GEFI, gefitinib; DMSO, dimethyl sulfoxide; c-PARP, cleaved PARP
