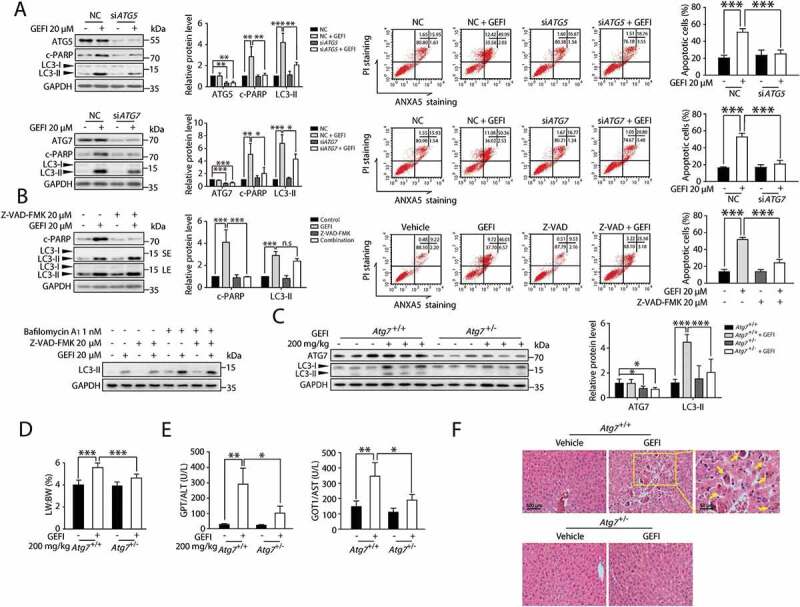
Figure 3.

Gefitinib-induced autophagy promotes apoptosis-associated hepatotoxicity. (A) HL-7702 cells were transfected with siRNA, targeting ATG5 (siATG5) or ATG7 (siATG7), or non-targeting siRNA (NC) for 24 h as indicated, followed by treatment with or without gefitinib. Relative protein expressions were detected by western blot. Apoptotic cells were identified using ANXA5-PI staining by flow cytometry after 48-h exposure (n = 3, one-way ANOVA, LSD test). (B) Determining the effect of Z-VAD-FMK on HL-7702 cells treated with gefitinib. Relative protein expressions were detected by western blot. Apoptotic cells were identified by flow cytometry after 48-h exposure (n = 3, one-way ANOVA, LSD test). (C-F) Atg7+/+ and Atg7+/- mice (n = 6 per group) were treated with gefitinib (200 mg/kg/day) by gavage for 4 weeks. The livers and sera were extracted. (C) The expressions of ATG7 and LC3 were analyzed by western blot. (D) Relative liver weights were calculated (n = 6, one-way ANOVA, LSD test) and (E) the levels of GPT/ALT and GOT1/AST were analyzed (n = 6, one-way ANOVA, Dunnett T3 test). (F) H&E staining of liver tissues. For 100× magnification, scale bar: 100 µm; for 200× magnification, scale bar: 50 µm. Yellow arrowheads indicated the cellular level showing prominent hematoxylin and eosin staining objects that were suggestive of apoptosis in specific regions. Western blot was repeated at least three times and densitometric analysis was carried out. The results are presented as the mean ± SD. n.s = no significance; *p < 0.05; **p < 0.01; ***p < 0.001. Abbreviations: GEFI, gefitinib; c-PARP, cleaved PARP; LW, liver weight; BW, body weight; GOT1/AST, glutamic-oxaloacetic transaminase 1, soluble; GPT/ALT, glutamic pyruvic transaminase, soluble; H&E, hematoxylin and eosin; SE, short exposure; LE, long exposure
