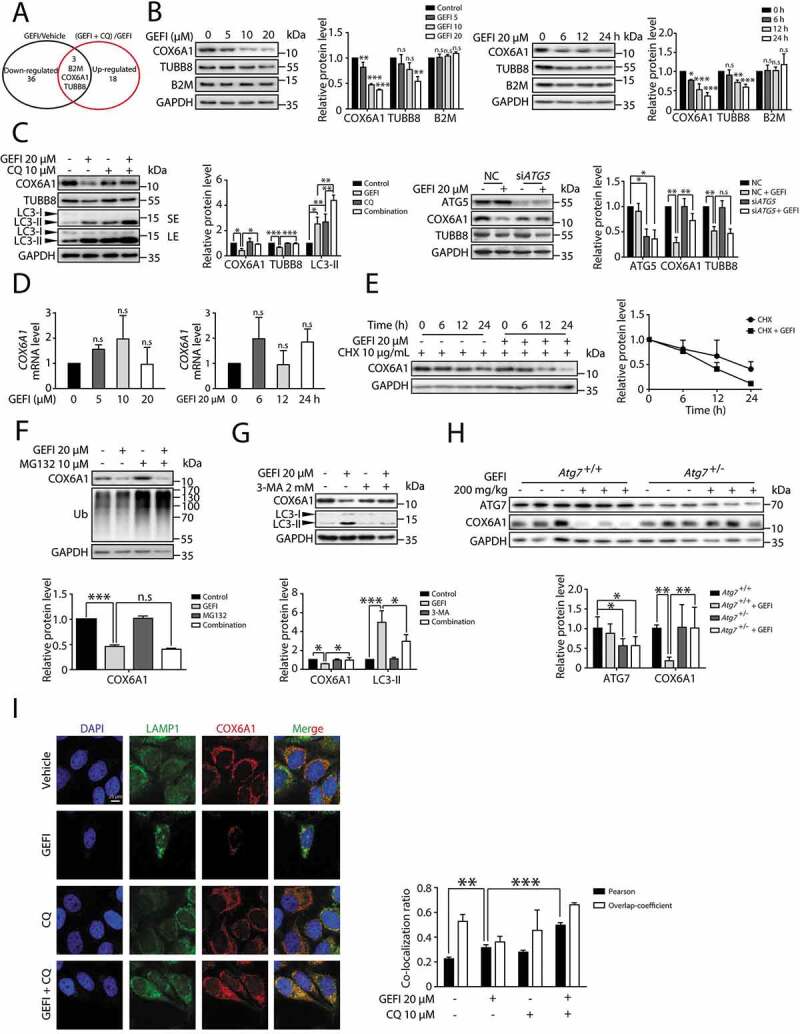
Figure 4.

Gefitinib activates autophagic degradation of COX6A1 in hepatocytes. (A) TMT quantitative proteomic profiling was used to determine the protein expression levels. The levels of the differentially expressed proteins were summarized, p < 0.05. (B) Differentially expressed proteins were detected by western blot in HL-7702 cells with gefitinib treatment. (C) The effect of autophagy inhibition on the expression of specific proteins. The influence of CQ and gefitinib treatment (left panel) and the effect of ATG5 knockdown under gefitinib treatment (right panel). The expression levels of COX6A1, TUBB8, LC3 and ATG5 were analyzed by western blot. (D) HL-7702 cells were treated with gefitinib at the indicated doses and time, and the mRNA expression of COX6A1 was analyzed by qPCR (one-way ANOVA, Dunnett T3 test and LSD test). (E) HL-7702 cells were treated with CHX with or without gefitinib for indicated time. COX6A1 was detected by western blot. (F) HL-7702 cells were treated with gefitinib or vehicle for 24 h or with MG132 for 8 h before the final time point. Western blot analysis was used to detect the expression levels of COX6A1 and Ub. (G) HL-7702 cells were treated by 3-MA with or without gefitinib for 24 h. Western blot was performed to measure the expression levels of COX6A1 and LC3. (H) Expressions of ATG7 and COX6A1 were analyzed by western blot in Atg7+/+ and Atg7+/- mice treated with gefitinib (200 mg/kg/day). (I) The cellular distribution of LAMP1 and COX6A1 in HL-7702 cells was observed by immunofluorescence. Scale bar: 25 μ. Pearson´s correlation coefficient and overlap coefficient values were analyzed. Western blot was repeated at least three times and densitometric analysis was carried out. The results are presented as the mean ± SD. n.s = no significance; *p < 0.05; **p < 0.01; ***p < 0.001. Abbreviations: TMT, Tandem Mass Tag; GEFI, gefitinib; CQ, chloroquine; qPCR, quantitative polymerase chain reaction; CHX, cycloheximide; Ub, ubiquitin; 3-MA, 3-methyladenine; SE, short exposure; LE, long exposure
