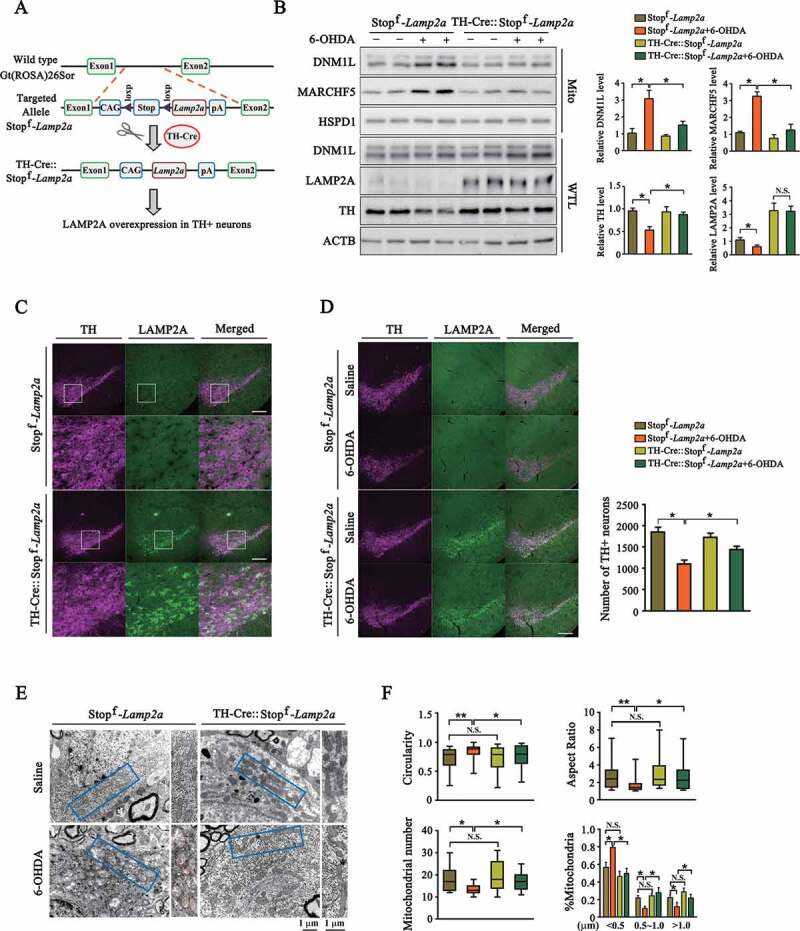
Figure 6.

Validation of CMA-MARCHF5-DNM1L axis in the SNc DA neurons expressing LAMP2A transgene. (A) A schematic presentation of the process of generating the TH-Cre::Stopf-Lamp2a transgenic mouse line. (B) 6-OHDA-induced changes in Stopf-Lamp2a and TH-Cre::Stopf-Lamp2a mouse brains. 6-OHDA (3 μg) or same volume of saline was stereotactically injected into the SNc region of Stopf-Lamp2a or TH-Cre:: Stopf-Lamp2a mouse. After 7 days, the SNc regions were harvested. Whole tissue lysates (WTL) or purified mitochondrial preparations were blotted. Quantifications of the indicated proteins are shown. (n = 3 animals per group). (C) Image analysis of the DA neurons of SNc. Representative immune-fluorescent images show the levels of TH (purple, Alexa Fluor 647) and LAMP2A (green, Alexa Fluor 488) in the Stopf-Lamp2a and TH-Cre::Stopf-Lamp2a mouse brains. Scale bar: 200 μm. The bottom two rows show the enlarged areas. (D) Imaging analysis of the effects of 6-OHDA in the SNc region of Stopf-Lamp2a or TH-Cre::Stopf-Lamp2a mouse brains. 6-OHDA was stereotactically injected in the SNc region of Stopf-Lamp2a or TH-Cre::Stopf-Lamp2a mouse. Immunofluorescence analysis was performed and representative images are shown. Scale bar: 200 μm. Right panel shows the quantification of TH-positive neurons in the SNc region. (n = 3 animals per group). (E) Transmission electron microscope (TEM) analysis of mitochondria in the SNc regions of from Stopf-Lamp2a or TH-Cre::Stopf-Lamp2a. The experiments were carried out as in (D). The SNc regions were analyzed by TEM and representative images are shown. (F) Quantification of mitochondrial morphological parameters and number. The boundaries of 25th and 75th percentiles are plotted in graphs for mitochondria aspect ratio, circularity (n = 200 mitochondria per group) and number per micrograph (n = 13 per group). Mitochondria are classified into three different groups according to their length (<0.5 μm, 0.5–1.0 μm and >1.0 μm) and their relative quantities were calculated (n = 200 mitochondria per group). Data are expressed as mean ± S.E.M. (Two-way ANOVA followed by Tukey’s post test for B, D and F [%Mitochondria]. Kruskal–Wallis tests followed by Dunn’s test for F [aspect ratio, circularity and mitochondrial number], *P < 0.05, **P < 0.01)
