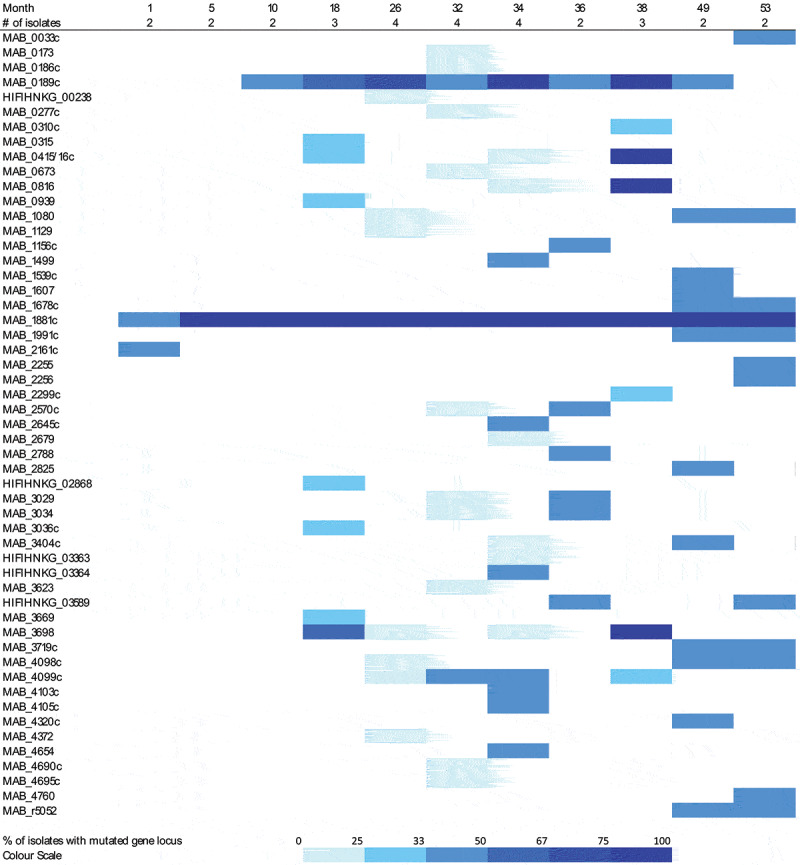
Figure 2.

Chronology of occurrence of non-synonymous chromosomal mutations in M. abscessus isolated during 4.5 years from patient C. The upper line shows the timepoints of sampling in months after first diagnosis of M. abscessus infection. The line below indicates the number of isolates sequenced from these samples. In the lower part on the left, the genes exhibiting non-synonymous mutations in any of the isolates are listed. On the right, the percentage of isolates with non-synonymous mutations in the specific genes is visualized by color depth according to the color scale shown below
