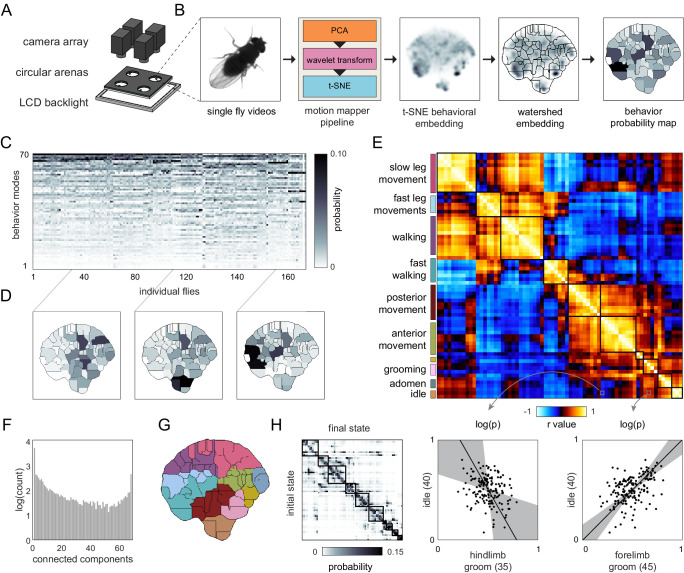
Figure 2. Correlation structure of unsupervised behavioral classifications.
(A) Schematic of the four camera imaging rig used to acquire single fly videos. (B) Overview of the data processing pipeline from single fly videos to behavioral probability maps. (C) Sample individual behavior mode probability density functions (PDFs visualized in an embedded t-SNE space). Discrete regions correspond to watersheds of the t-SNE embedding. (D) Sample individual PDFs mapped to locations in t-SNE space. Discrete regions correspond to watersheds of the t-SNE embedded probability densities. (E) Correlation matrix (top) for individual PDFs with rows and columns hierarchically clustered. Colored blocks indicate labels applied to classifications post hoc. Example scatter plots (bottom) of individual behavioral probabilities. Points correspond to probabilities for individual flies. Line is the best fit (principal component [PC]1 of these points), gray region is the 95% confidence interval of the fit, as determined by bootstrap resampling. (F) Connected components histogram of the thresholded PDF correlation matrix (see Materials and methods). (G) Discrete behavioral map with individuals zones colored by post hoc labels as in (E). (H) Transition probability matrix for behavioral classifications. Entries in the ith row and jth column correspond to the probability of transitioning from state i to state j over consecutive frames. Blocks on the diagonal indicate clusters of post hoc labels as in (E) and (G).


