. 2021 Oct 19;10:e64988. doi: 10.7554/eLife.64988

Figure 5. Analysis of Drosophila behavioral covariation in other non-isogenic populations.

(A) Correlation matrices of previously published data sets. Rows correspond to analyses performed on each data set. From left to right, the data sets (columns) are as follows: line averages of supervised behavioral classifications following thermogenetic inactivation in the fly olympiad screen (Robie et al., 2017), line averages of behavioral phenotypic data from wild-type inbred lines in the Drosophila Genomic Reference Panel (DGRP) database, line averages of physiological phenotypic data from the DGRP database, line averages of the fold change in unsupervised behavioral classifications following optogenetic activation of descending neurons (Cande et al., 2018). (B) Connected components spectra for each correlation matrix (see Materials and methods). Color in the rightmost plots (B–D) indicates either control (Gal4 driver only) or experimental animals (Gal4 × dTrapA1). (C) Points corresponding to lines nonlinearly embedded using t-SNE from the D-dimensional raw measure space to two dimensions (from left to right, d = 871, 31, 77, 151). (D) Points corresponding to lines nonlinearly embedded using t-SNE from the n-dimensional raw measure space to two dimensions (from left to right, n = 2083, 169, 169, 176).

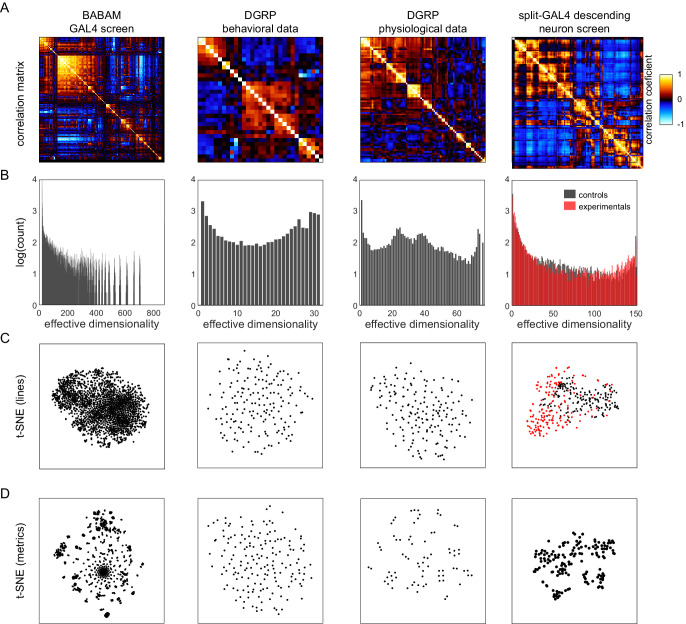
Figure 5.

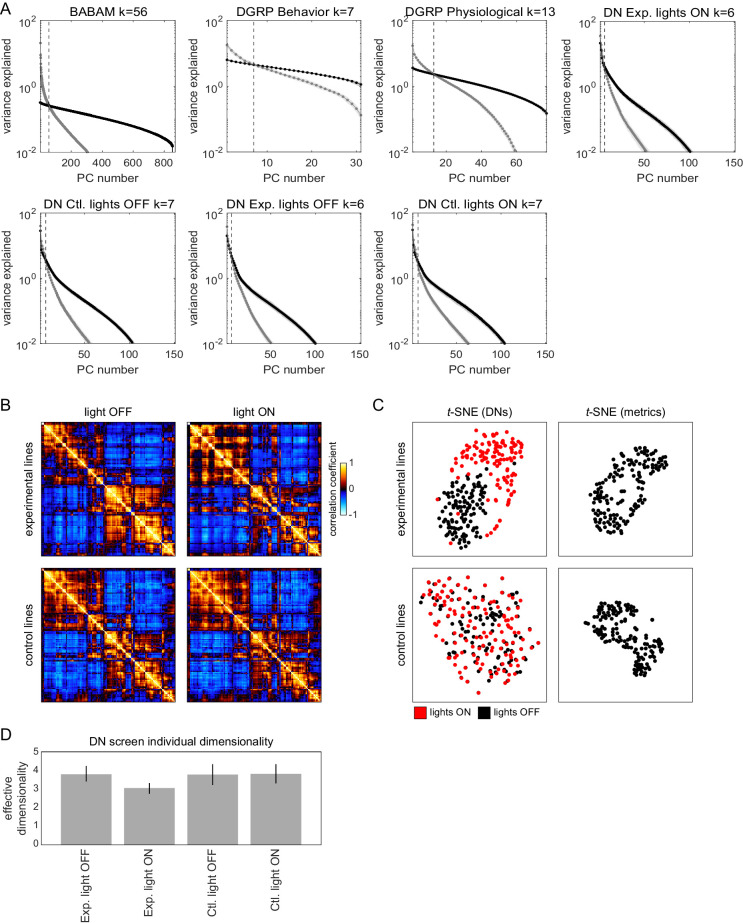
Figure 5—figure supplement 1. Structure of behavioral variation in non-Decathlon data sets.

Figure 5—figure supplement 1.

(A) Scree plots showing the variance explained for each principal component (PC) of the BABAM Gal4 screen, Drosophila Genome Reference Panel (DGRP; behavioral and physiological), and descending neuron screen (all experimental groups and conditions) behavioral data sets. Point colors indicate variance explained for the observed (gray) and shuffled (black) data matrices. The dashed line indicates a simple metric of dimensionality (k), where the variance explained of the observed PCs is below the 95% confidence interval (shaded regions) of the shuffled data. (B) Correlation matrices for the combined behavioral probability density function (PDF) for each descending neuron set separated by experimental group and condition. (C) t-SNE embeddings of the descending neurons lines (left) and unsupervised measures (right) from the descending neuron screen. Color of the data points in the left-hand plot indicates whether individuals were control (black; Gal4/+) or experimental (red; Gal4/UAS-CsChrimson). (D) Average dimensionality k (as measured by the intersection of observed and shuffled ranked PC variances) of the individual behavioral PDFs separated by experimental group and condition. Error bars are the 95% confidence interval of the mean.