. 2021 Oct 7;10:e69958. doi: 10.7554/eLife.69958

Figure 4. Multiple SASP factors show a marked increase in the healing callus, while distinct genes form similarly behaving clusters.

SASP-associated factors can be subdivided into functional subunits. (A) mRNA expression of the growth factors Vegfa, Igfbp3, and Igfbp4 substantially increased during the callus forming phase (days 2–15). (B) The chemokines Ccl2 and Pdgfa more profoundly rose in gene expression levels in the soft callus (days 2–7) but not in the hard callus (days 8–14) phase, while Ccl7 was more than 70-fold increased on day 14. (C) Expression of the protease Serpine1 was elevated in the soft callus phase, similar to Pdgfa, while Mmp9 and Mmp13 peaked on day 14. (D) The transcription factors Foxo4, Nfkb1, and Tp53 peaked on day 8, marking the beginning of hard callus formation. (E) TGFβ-associated genes displayed heterogeneous expression patterns. While Tgfbr1 peaked on day 14, Tgfb1 reached a plateau on days 8 and 14, and Tgfb2 gradually declined after an initial peak on day 4. (F) Among the interleukins, Il1b was negatively regulated in the beginning of the healing phase, while Il6 shortly peaked in the inflammatory and soft callus phase. Il17a showed a gradually decline, comparable to Tgfb2. (G) The largest cluster displaying similar gene expression patterns among all senescence-associated and SASP-gene markers included the key cell cycle regulators Cdkn2aInk4a and Cdkn1aCip1. The square size is proportional to the correlation coefficient, which is also depicted in the left bottom corner. Significant results were indicated with asterisks. A-G: n = 24 (n = 24 in Contra, n = 24 in Fx, 6 per time point per group), all male. Mean ± SEM. Multiple t-test (FDR); *p < 0.05, **p < 0.01, ***p < 0.001, ****p < 0.0001.

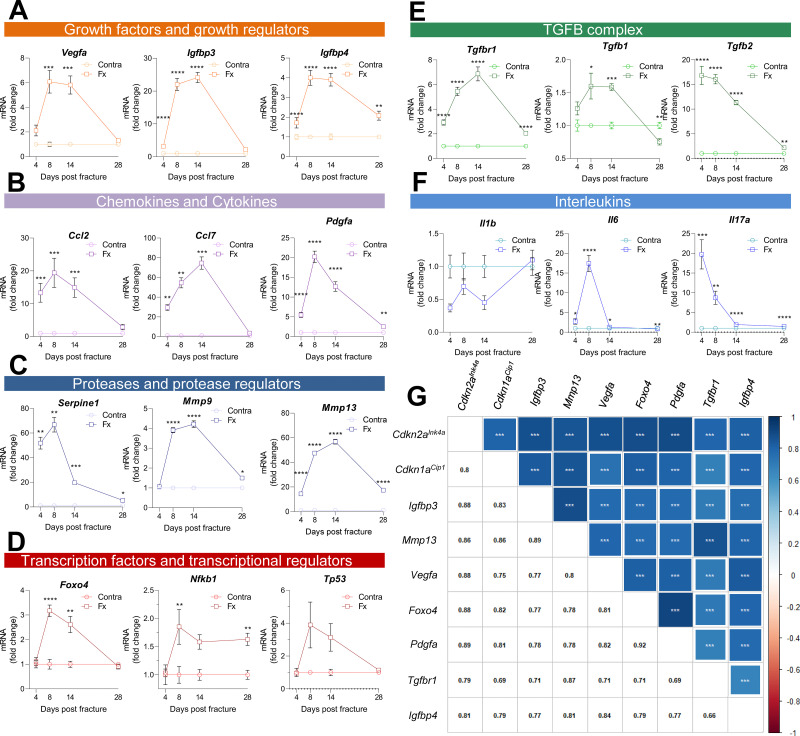
Figure 4—source data 1. Source data (raw ct values, for Figure 4, panel A-F), raw matrix (panel G).

Figure 4.

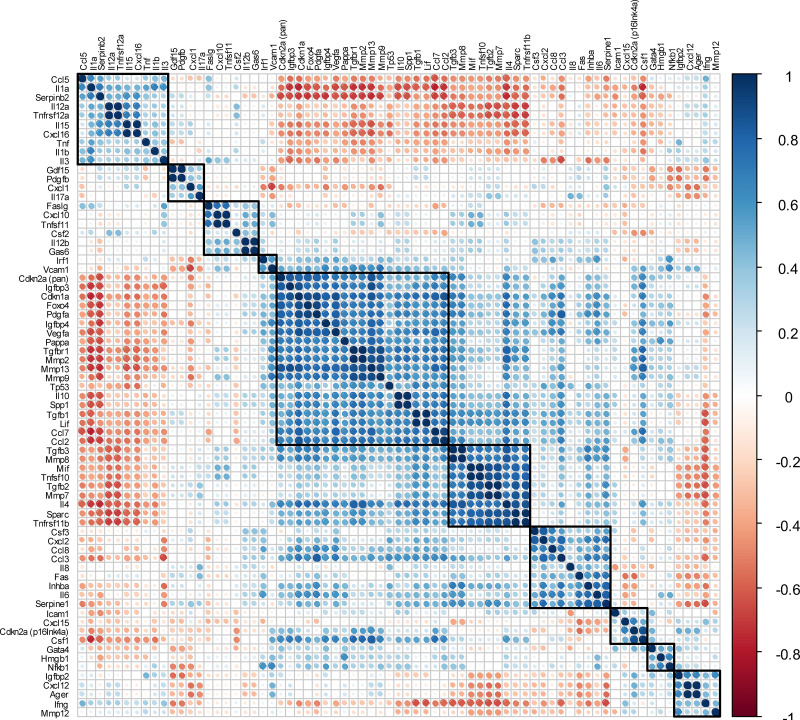
Figure 4—figure supplement 1. Matrix of all SASP-associated genes and the two senescence key regulators Cdkn2aInk4a and Cdkn1aCip1.

Figure 4—figure supplement 1.

(A) All SASP-associated genes and the two senescence key regulators Cdkn2aInk4a and Cdkn1aCip1 are displayed. The color of each dot and its size represent the correlation coefficient (blue: positively regulated, red: negatively regulated). Automated clustering led to ten clusters, out of which the largest central cluster was depicted in Figure 4G. A: n = 48 (n = 24 in Contra, n = 24 in Fx, n = 6 per timepoint), all male.
Figure 4—figure supplement 1—source data 1. Raw matrix of the calculated matrix.
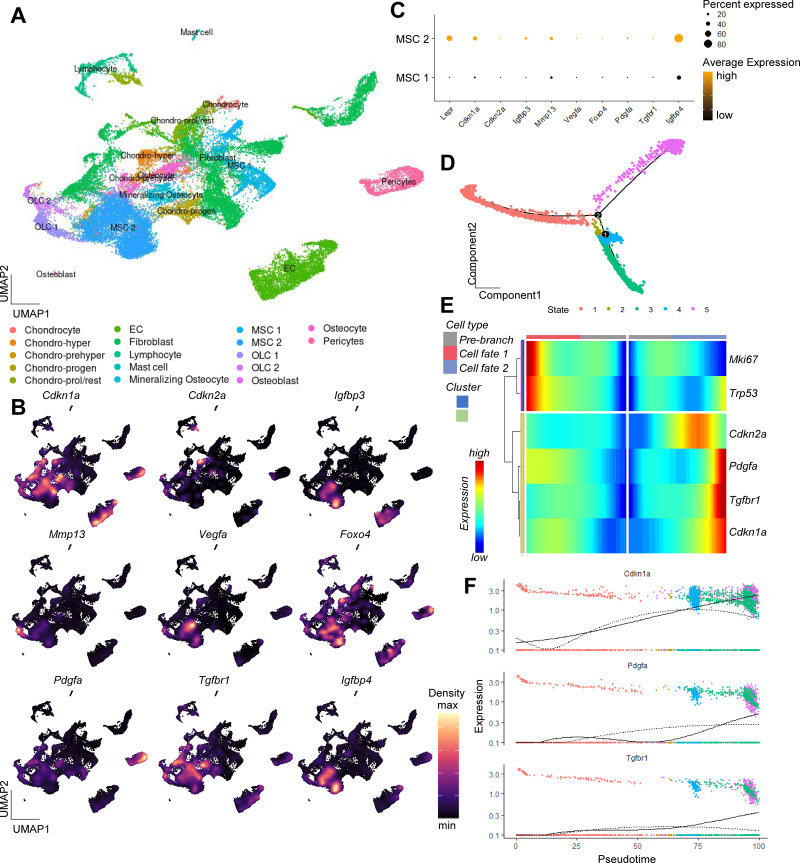
Figure 4—figure supplement 2. Single-cell analysis of murine bone and bone marrow unveiling a potential origin of SASP secreting cells.

Figure 4—figure supplement 2.

(A) A Uniform Manifold Approximation and Projection (UMAP) representation of murine bone and bone marrow (Baryawno et al., 2019, GSE128423), after unsupervised clustering using the Seurat package (Butler et al., 2018). Distinct cellular populations were clustered based on their expression patterns. (B) Applying the expression pattern of the experimentally verified central senescence-associated and SASP genes, the highest overlap was found within the MSC cluster, specifically in the MSC two cluster (C), which was used for the subsequent pseudotime analysis. The density of each population’s expression is estimated using Kernel Gene-Weighted Density with Nebulosa (Alquicira-Hernandez and Powell, 2021) (D) Pseudotime of MSCs showed divergent cell fates (branch point 2), out of which (E) oone fate is characterized by increased Pdgfa, Tgfbr1, and Cdkn1aCip1 and reduction of Mki67, pointing at a senescent state. (F) The longitudinal pseudotime expression pattern depicts a marked increase of Cdkn1aCip1 in the late cellular fate along with certain SASP markers like Pdgfa and Tgfbr1. A-E: n = 8, all male.