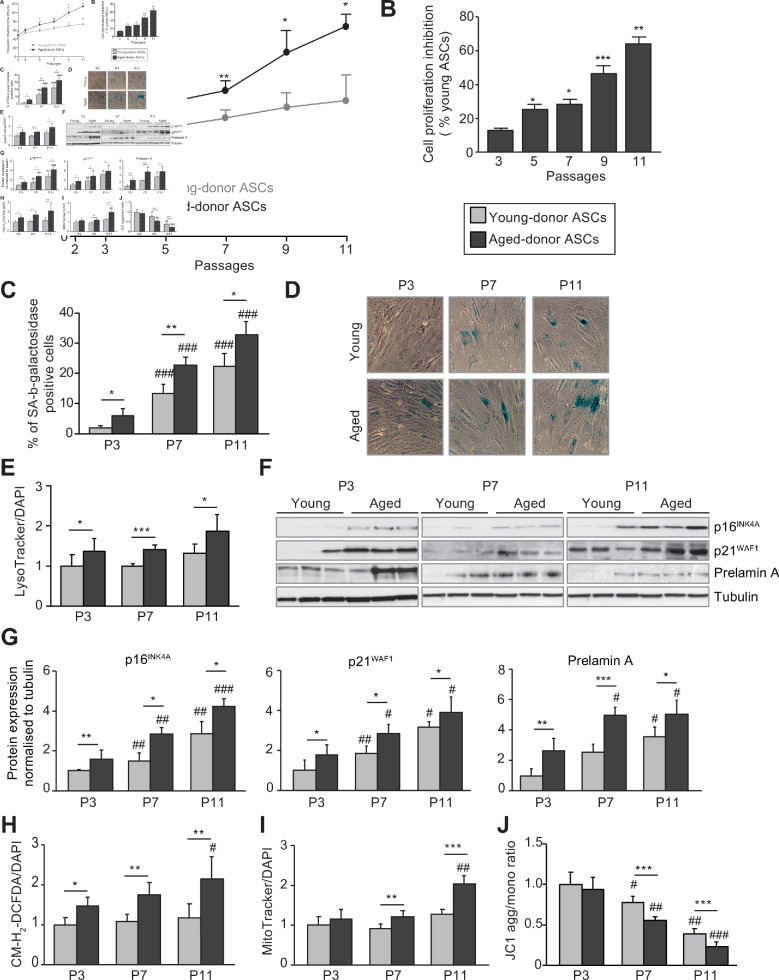
Figure 1. In vivo and in vitro aging are differently associated with senescence, oxidative stress, and mitochondrial dysfunction in cultured adipose-derived stromal cells (ASCs).
After isolation from the abdominal subcutaneous adipose tissue (SCAT) of young (gray circles or bars) and aged (black circles or bars) donors, ASCs were cultured from passages (P) 3–11. (A). Calculation of the mean ± standard error of the mean (SEM) population doubling time (PDT) is described in the Materials and methods section. Times were determined at the indicated passage (n = 9, in triplicate). (B) The % inhibition of cell proliferation was calculated for aged-donor ASCs by determining the increase in total cell number that occurred after 7 days, compared to young-donor ASCs. (C) Senescence was evaluated in terms of senescence-associated (SA)-β-galactosidase activity and expressed as the proportion (in %) of SA-β-galactosidase-positive cells at pH 6 in aged-donor ASCs vs. young-donor ASCs at the same passage (at P3, P7, and P11). (D) Representative micrographs of SA-β-galactosidase-positive cells. (E) Lysosomal accumulation (normalized against 4′,6-diamidino-2-phenylindole dihydrochloride [DAPI]) was assessed with the Lysotracker fluorescence probe and expressed as the fluorescence ratio for aged-donor ASCs vs. young-donor ASCs at P3. (F) Whole-cell lysates of aged-donor and young-donor ASCs at P3, P7, and P11 were analyzed by immunoblotting. Representative immunoblots of the cell cycle arrest markers p16INK4A and p21WAF1, prelamin A, and tubulin (the loading control) from three donors in each group are shown. (G) Quantification of western blot was normalized to young-donor ASCs at P3. (H) Reactive oxygen species production (normalized against DAPI) was assessed by the oxidation of CM-H2DCFDA and expressed as a ratio relative to young-donor ASCs at P3. (I) Mitochondrial mass (normalized against DAPI) was evaluated with Mitotracker Red-Probe and expressed as a ratio relative to young-donor ASCs at P3. (J) The cationic dye JC1 was used to evaluate the mitochondrial membrane potential. The results are expressed as the ratio of aggregate/monomer fluorescence. Results are quoted as the mean ± SEM. *p < 0.05, **p < 0.01, ***p < 0.001 for aged- vs. young-donor ASCs, #p < 0.05, ##p < 0.01, ###p < 0.001 vs. young- or aged-donor ASCs at P3. All experiments were performed in triplicate with ASCs isolated from four different donors in each group.

