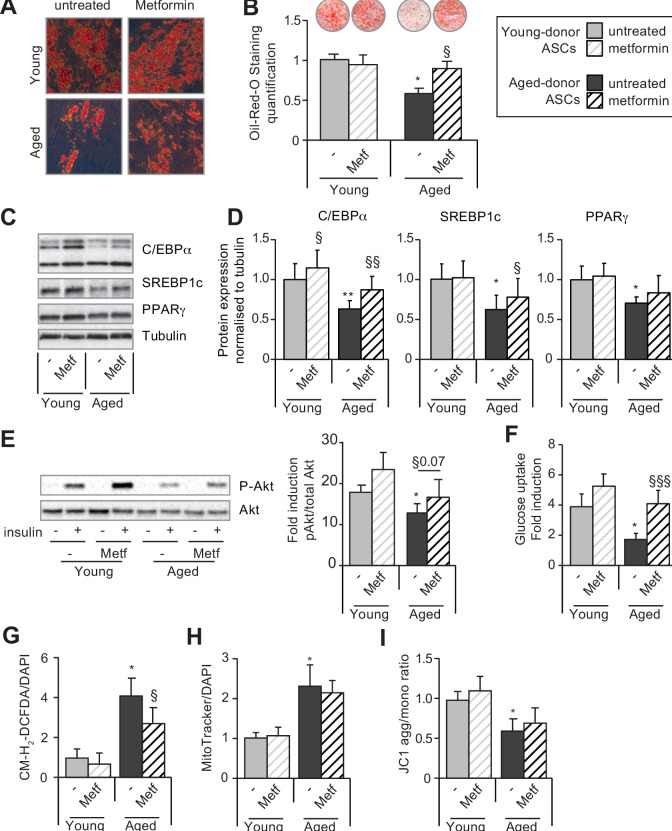
Figure 7. Metformin can improve the adipogenic differentiation capacity of aged-donor but not young-donor adipose-derived stromal cells (ASCs).
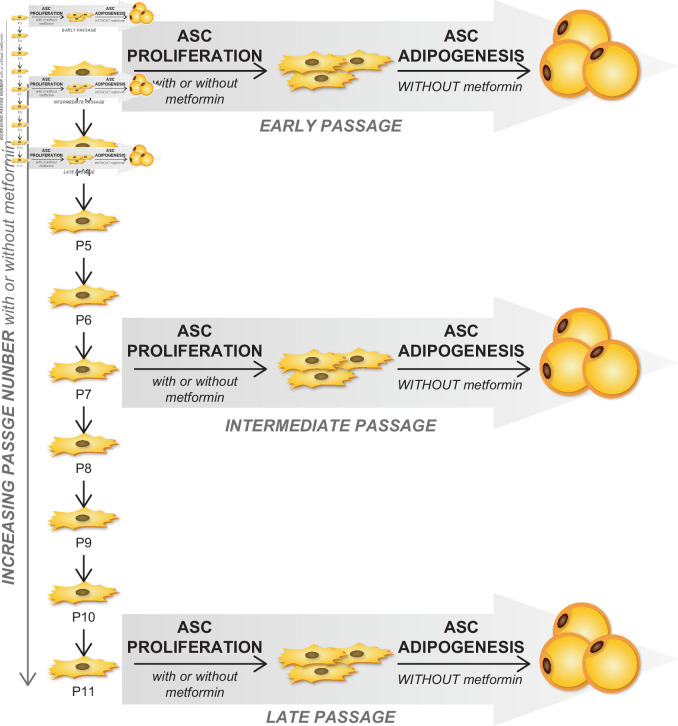
Metformin was added to the culture medium of young- and aged-donor ASCs from P3 onward. The ASCs were differentiated into adipocytes for 14 days at P11, in the absence of metformin (young-donor ASC: gray bars in the absence of metformin, gray striped bars in the presence of metformin; aged-donor: black bars in the absence of metformin, black striped bars in the presence of metformin). (A) Cells were stained with Oil-Red-O to visualize lipid droplets 14 days post-induction, and representative micrographs are shown. (B) Quantification of Oil-Red-O staining and representative scans of wells are shown. (C) Whole-cell lysates on day 14 post-induction from adipocytes differentiated from non-treated young-donor and aged-donor ASCs at P11 and treated (or not) with metformin were analyzed by immunoblotting. Representative immunoblots of C/EBPα, SREBP-1c, PPARγ, and tubulin (the loading control) are shown. (D) Quantification of western blots is shown. (E) Whole-cell lysates extracted at day 14 post-induction stimulated (or not) by insulin from differentiated ASCs were analyzed by immunoblotting. Representative immunoblots of Akt and phospho-Akt (Ser473) and quantification of the pAkt/Akt are shown. (F) Insulin sensitivity was evaluated at P11 in adipocytes differentiated from non-treated young-donor and aged-donor ASCs treated (or not) with metformin, by measuring the glucose uptake in response to insulin and calculating the insulin fold induction, as described in the Materials and methods section. (G) Reactive oxygen species (ROS) production, (H) mitochondrial mass, and (I) mitochondrial membrane potential (both normalized against 4′,6-diamidino-2-phenylindole dihydrochloride [DAPI]) were assessed as described in Figure 1. The results are expressed as the mean ± standard error of the mean (SEM). *p < 0.05 for adipocytes differentiated from aged-donor vs. adipocytes differentiated from young-donor ASCs, §p < 0.05, §§p < 0.01, §§§p < 0.001 metformin-treated vs. non-treated adipocytes differentiated from ASCs. All experiments were performed in duplicate on cells isolated from three different donors in each group.


