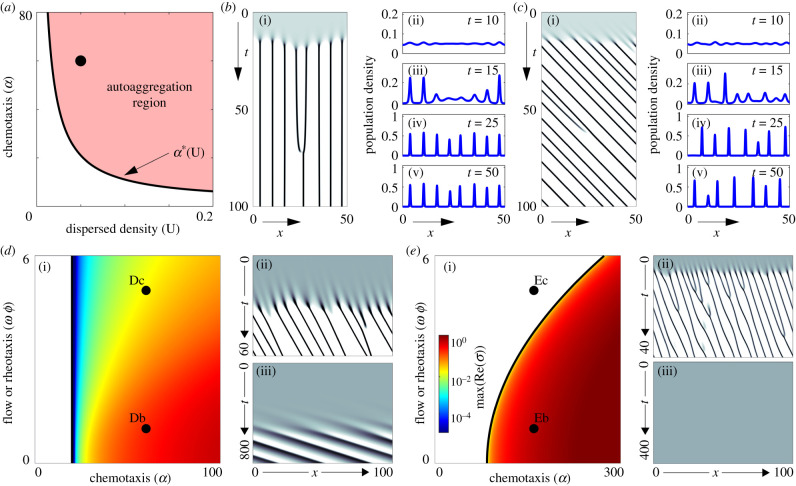
Figure 2.
Aggregation in a uniform flow. (a) Autoaggregation parameter space (α - U), with parameters for plots in (b,c) indicated by dot. Note that here we assume negligible population growth (ρ = 0). (b) Autoaggregation in a still environment, ω = 0. Population density u represented as (b)(i) space–time map (white u(x, t) = 0, black u(x, t) ≥ 4U) and snapshots in (b)(ii–v). (c) As (b), but under constant flow (ω = 1). (d) Autoaggregation parameter space (α - ϕω, coloured region) under rheotaxis and flow (zero population growth, ρ = 0). Colour (see inset of (e)(i)) indicates the cluster growth rate predicted by LSA (deep red = faster growth). Space–time density maps for marked points: (d)(ii) α = 60, ω = 1, ϕ = 1; (d)(iii) α = 60, ω = 5, ϕ = 1. (e) As (d) but including population growth (ρ = 1). (e)(ii) α = 150, ω = 1, ϕ = 1; (e)(iii) α = 150, ω = 5, ϕ = 1. For all simulations, we have set initial densities as dispersed (u0(x) = U, v0(x) = U + ε(x), for small random (specifically, random white noise) perturbations ε(x)). Non-specified parameters are U = 0.05 and δ = 1. Details of the LSA are provided in the appendix.

