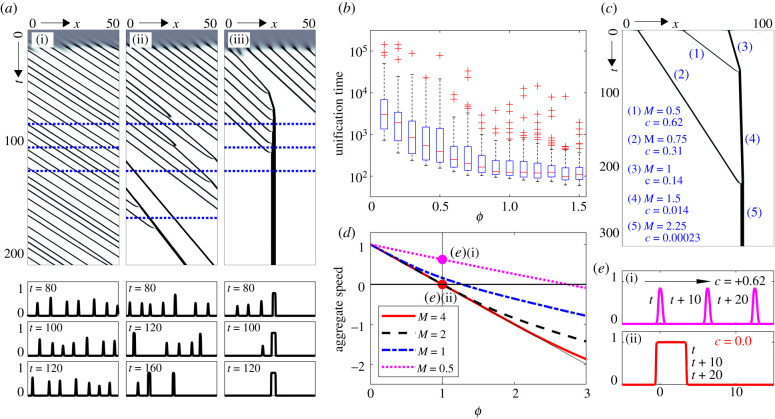
Figure 3.
(a,b) Accelerated unification through the action of rheotaxis. (a) Space–time population density maps showing cluster evolution under a constant flow (ω = 1) and (i) negligible (ϕ = 0), (ii) under-compensating (ϕ = 0.5), (iii) compensating rheotaxis (ϕ = 1). (b) Boxplot showing the mean time to reach a unified cluster (averaged across 100 randomized initial data). For (a,b), initial distributions are as in figure 2. (c) Evolving density for a population initialized as three separated Gaussian shaped clusters of masses m = 0.5, 0.75 and 1, centred at x = 40, 10 and 70, respectively. (d) Computed cluster speed, c, as a plot of rheotaxis strength, ϕ, for isolated clusters of mass m; dotted vertical line indicates compensating rheotaxis and horizontal solid line indicates holding position. (e) Travelling pulse profile for a cluster of mass (i) m = 0.5 and (ii) m = 4 under compensating rheotaxis. Density u(x, t) shown at t = t*, t* + 10, t* + 20, with arrow indicating movement direction. In (a–e), ρ = 0, δ = 1 and α = 80.

