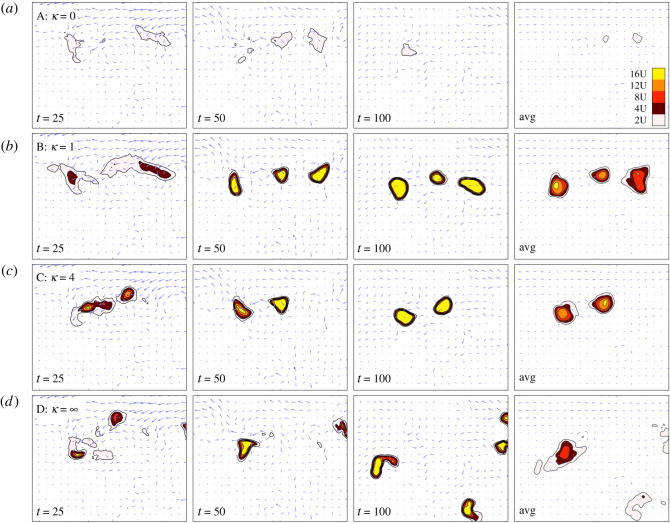
Figure 6.
Dynamics of an initially dispersed populations exhibiting density-dependent rheotaxis. Each panel shows the instantaneous flow field (arrows) and population density u, (colourscale: top right). Strong flow from figure 5. Rheotaxis coefficient ϕ = ϕup/(κp + up), for: (a) κ = 0 (constant compensating rheotaxis); (b) κ = 1; (c) κ = 4; (d) κ = ∞ (zero rheotaxis). Initial distributions u0(x) = U, v0(x) = U + ε(x) and we use ϕ = 1, p = 2, ρ = 0, δ = 1, U = 0.05, α = 15 (weak chemotaxis regime). Flowfield uses the hycom dataset described in methods.

