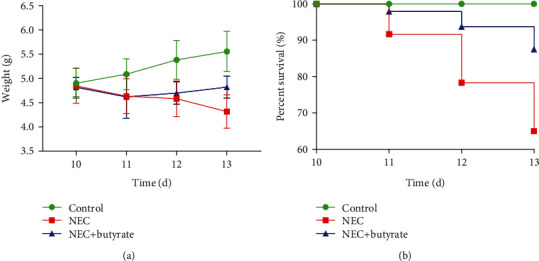
Figure 1.

(a) Body weight changes in newborn mice in the three groups. Number of samples: control (n = 8), NEC (n = 8), and NEC+butyrate (n = 8). Statistical analysis: two-way ANOVA multiple comparisons method. (b) Survival curves of newborn mice in the three groups. The survival rate was estimated during modeling, and the results are shown as a Kaplan-Meier plot. Numbers of samples at the beginning: control (n = 40), NEC (n = 60), and NEC+butyrate (n = 48). Statistical analysis: log-rank (Mantel-Cox) test (P < 0.05). Control: normal control; NEC: necrotizing enterocolitis; NEC+butyrate: sodium butyrate-treated necrotizing enterocolitis.
