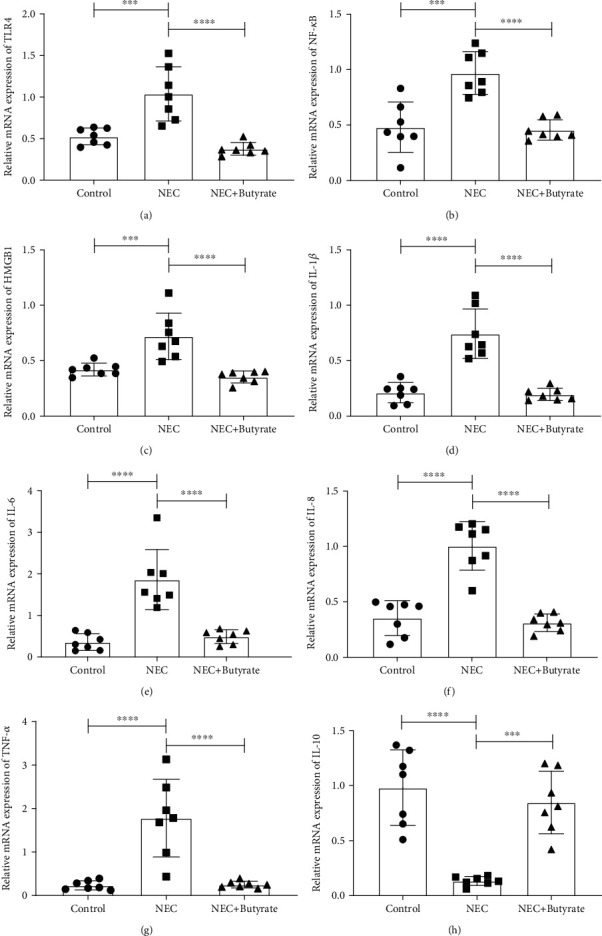
Figure 3.

The relative mRNA expression of inflammatory cytokines in the three groups: (a) TLR4; (b) NF-κB; (c) HMGB1; (d) IL-1β; (e) IL-6; (f) IL-8; (g) TNF-α; (h) IL-10. Number of samples: control (n = 7), NEC (n = 7), and NEC+butyrate (n = 7). Statistical analysis: one-way ANOVA. ∗∗∗P < 0.001; ∗∗∗∗P < 0.0001.
