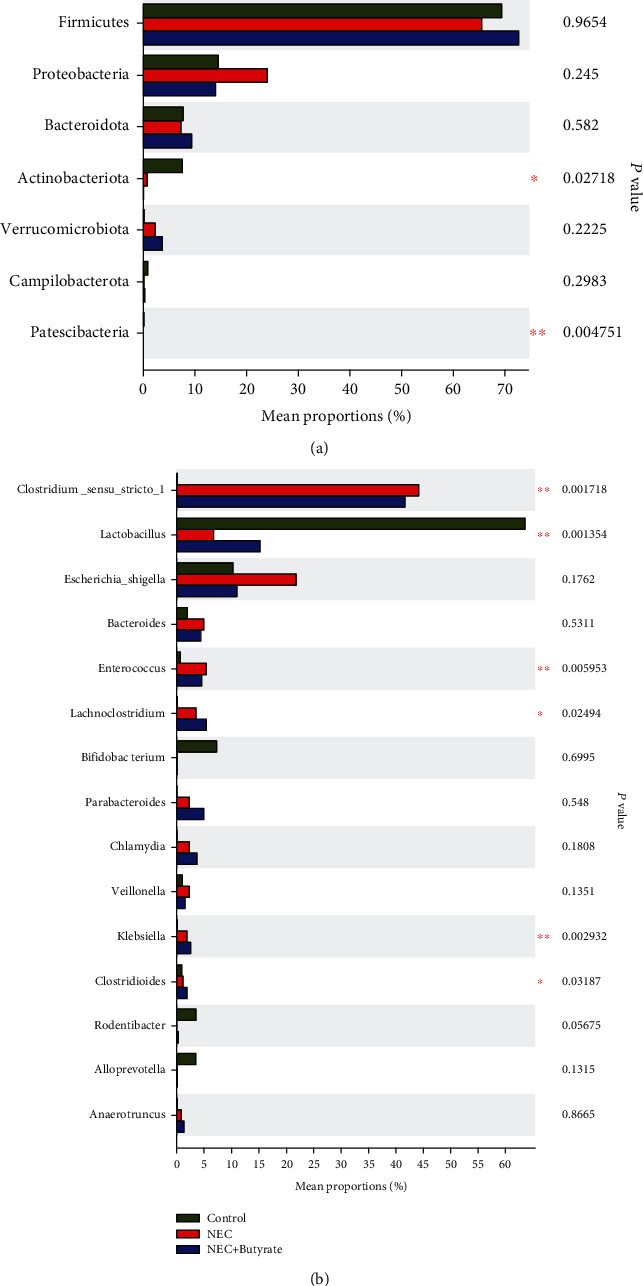
Figure 6.

(a) Differences in the proportions of microflora constituents at the phylum level in mice in the three groups. ∗The top seven phyla are shown in the figure. (b) Differences in the proportions of microflora constituents at the genus level in mice in the three groups. Number of samples: control (n = 7), NEC (n = 7), and NEC+butyrate (n = 7). Statistical analysis: Kruskal-Wallis H test. ∗0.01 < P ≤ 0.05; ∗∗0.001 < P ≤ 0.01.
