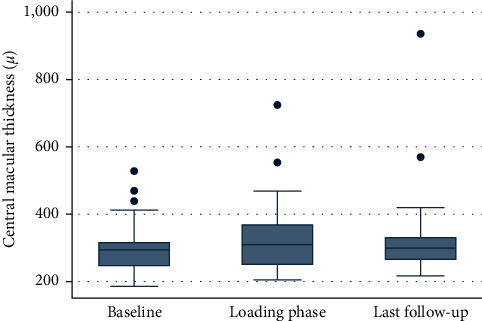
Figure 2.

Boxplot analysis illustrates central macular thickness in μm at the analyzed timepoints. The ordinate shows central macular thickness in μm for the eyes at baseline prior to treatment switch (left side), after the loading phase which is three injections of bevacizumab (middle), and at last available follow-up visit (right side) shown on the abscissa. Statistically significant results (pairwise comparison Wilcoxon test, p < 0.05) are marked with an asterisk.
