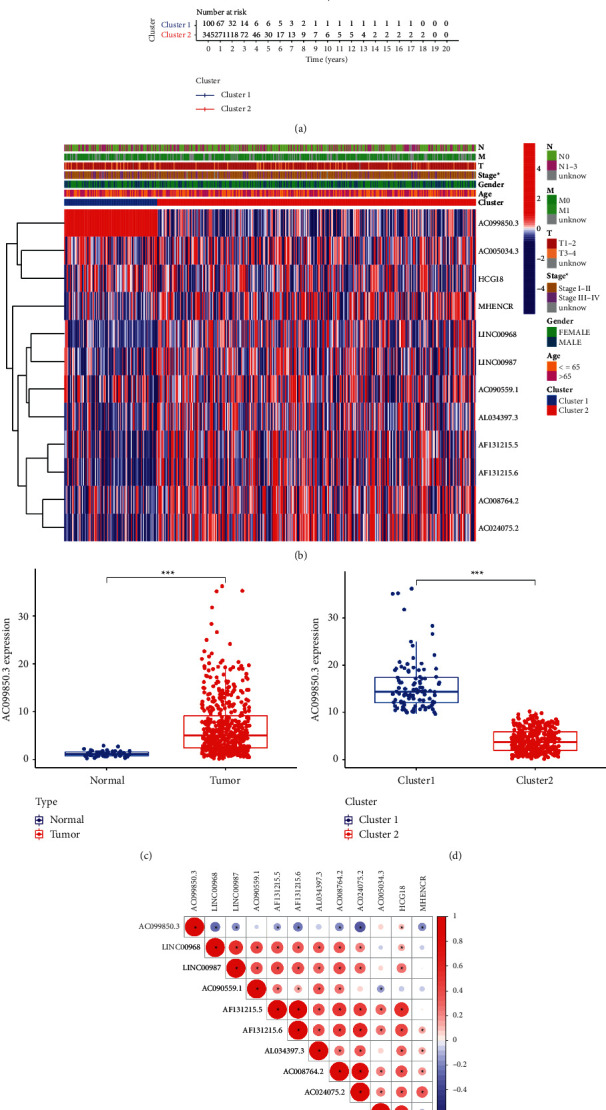
Figure 3.

Differential clinicopathological features and overall survival of NSCLC patients in the two cluster subgroups. (a) Kaplan–Meier overall survival (OS) curves for 497 lung cancer patients from the TCGA database. The cluster 1 subgroup is noted with blue, and the cluster 2 subgroup is noted with red. (b) Heatmap and clinicopathologic features of the two cluster (cluster 1 and 2) subgroups and the expression of partial acetylation-related lncRNA in two subgroups. (c) The expression of lncRNA AC099850.3 in 54 normal tissues and 497 cancer samples. (d) The expression of lncRNA AC099850.3 in the two clusters (clusters 1 and 2). (e) Spearman correlation analysis of the correlation between 12 lncRNAs in lung cancer. ∗P < 0.05 and ∗∗P < 0.01.
