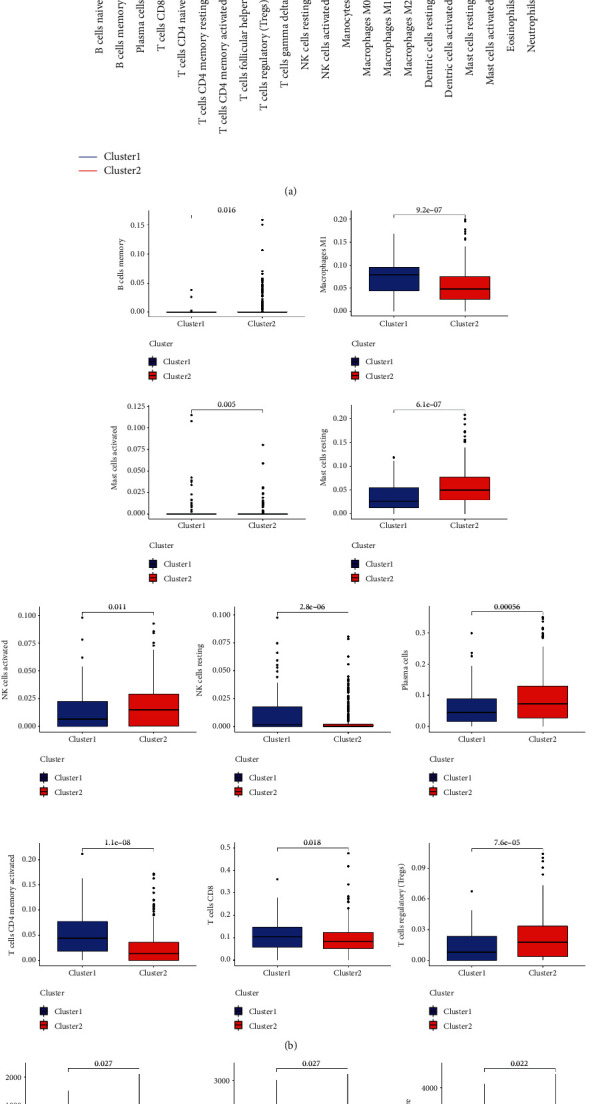
Figure 4.

Differential immunocyte infiltration analysis and tumor microenvironment score of NSCLCs in the cluster 1 and 2 subgroups: (a) comparison of immune cell content in samples from two subgroups; (b) the expression of differences in immune cells; and (c–e) ImmuneScores, StromalScores, and ESTIMATEScores in the cluster 1 and 2 subgroup. P < 0.05 is statistically significant.
