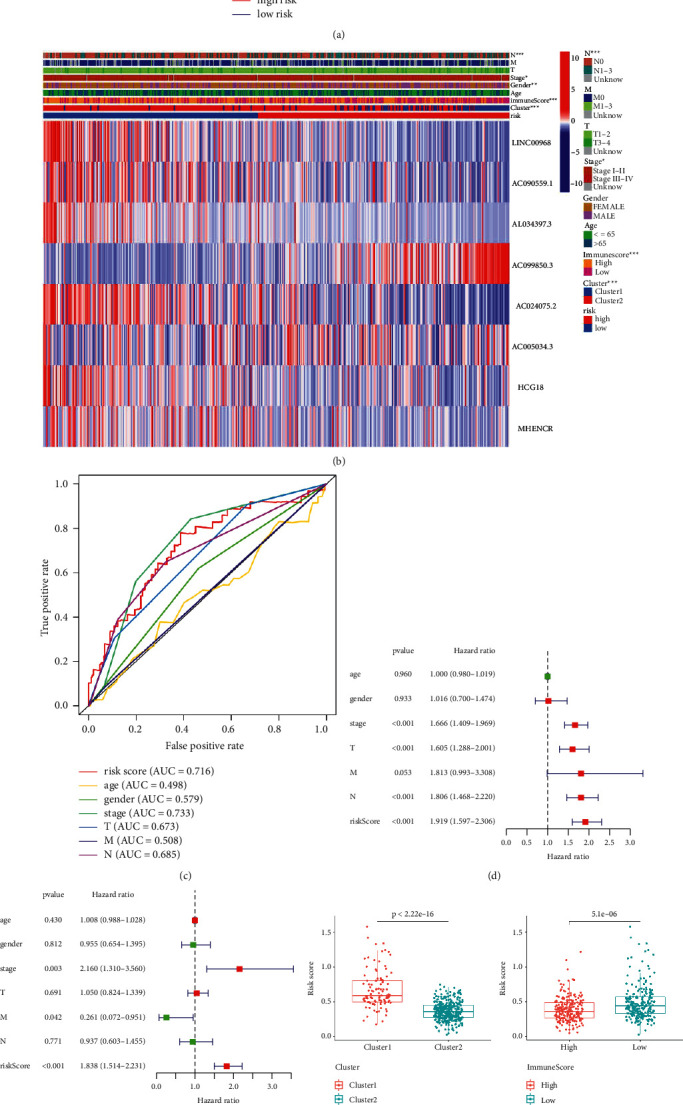
Figure 5.

Risk scores are closely related to clinicopathological features and prognostic in NSCLC. (a) Kaplan–Meier overall survival (OS) curves for high- and low-risk patients. (b) The heatmap shows the expression levels of partially acetylation-related lncRNA in two risk groups (low and high) of NSCLC patients. And, the clinicopathological features were compared between the low- and high-risk groups. (c) The ROC curve shows the predictive efficiency of predictors, which includes various clinical characteristics and the risk score, for the survival of NSCLC patients. (d) Univariate Cox regression analysis shows that the relation between clinicopathological factors (including the risk score) and overall survival of patients in the TCGA data sets. (e) Multivariate Cox regression analysis. (f) Difference analysis of risk score in the clusters 1 and 2 and ImmuneScore group of low and high. (g) The expression analysis lncRNA AC099850.3 in high- and low-risk groups. ∗P < 0.05, ∗∗P < 0.01, and ∗∗∗P < 0.001.
