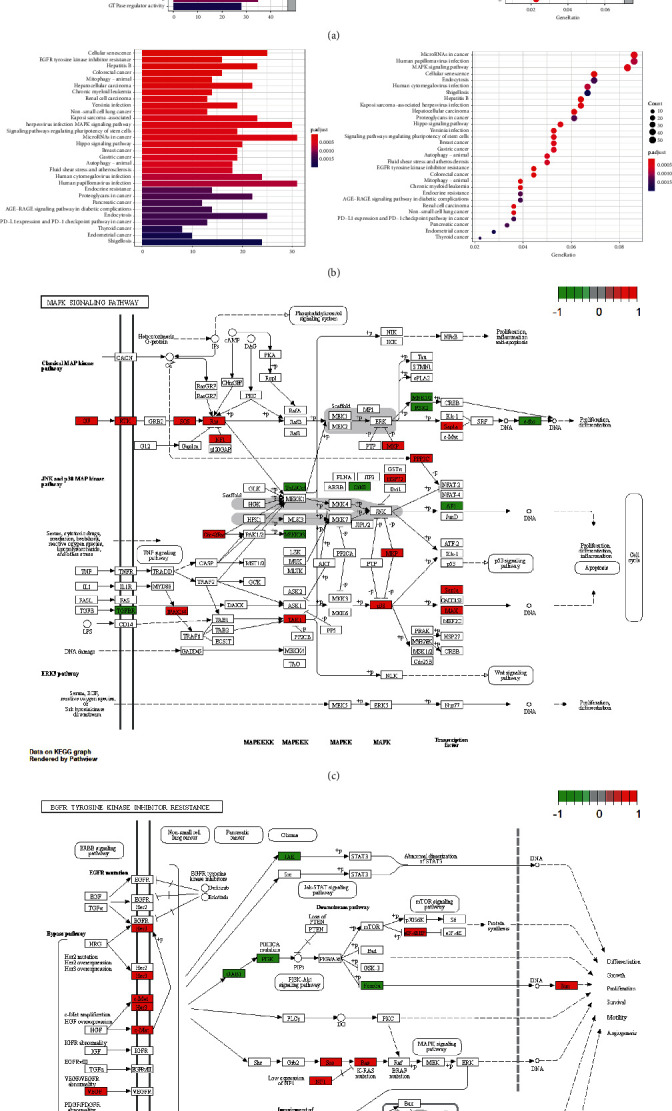
Figure 6.

GO and KEGG enrichment analysis of acetylation-related lncRNAs: (a) GO enrichment analysis of acetylation-related lncRNAs; (b) KEGG enrichment analysis of acetylation-related lncRNAs; and (c and d) the network diagram of MAPK and EGFR signaling pathway. Red represents upward, and green represents downward.
