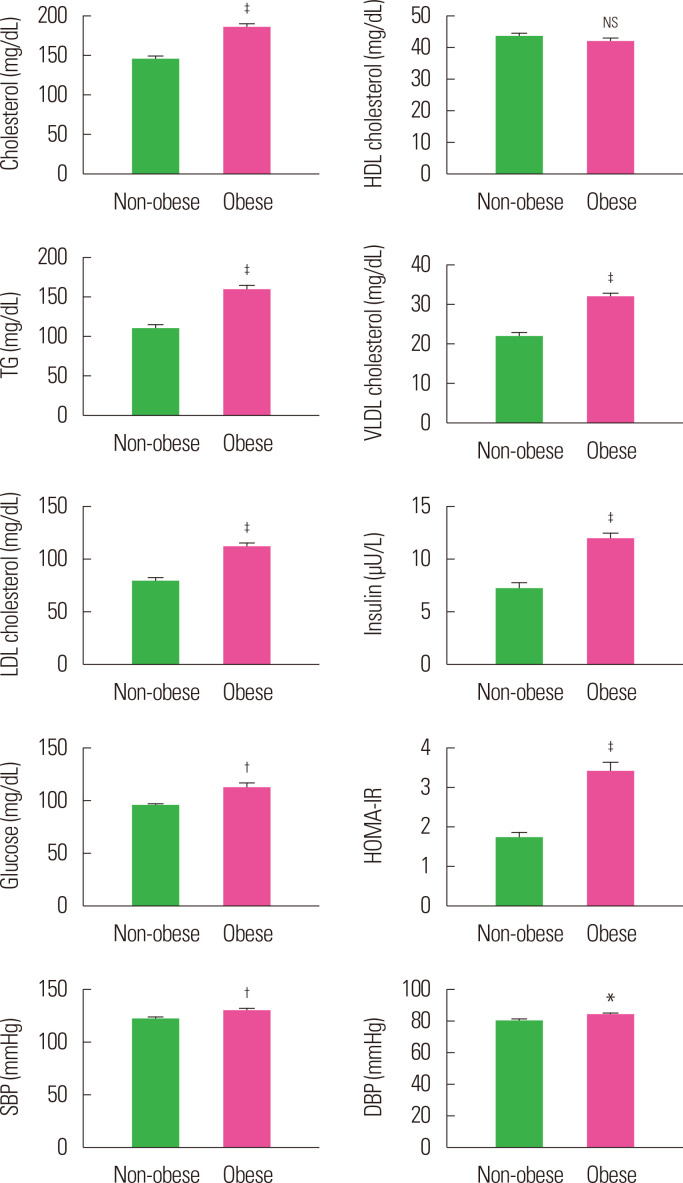
Figure. 1.
Mean biochemical risk factor levels of non-obese and obese subjects. Values are presented as mean± standard error of the mean. *P< 0.05, †P< 0.01, ‡P< 0.001, and NSP> 0.05, as compared to non-obese. HDL, high-density lipoprotein; TG, triglyceride; VLDL, very low density lipoprotein; LDL, low-density lipoprotein; SE, standard error of the mean; SBP, systolic blood pressure; DBP, diastolic blood pressure; NS, not significant.

