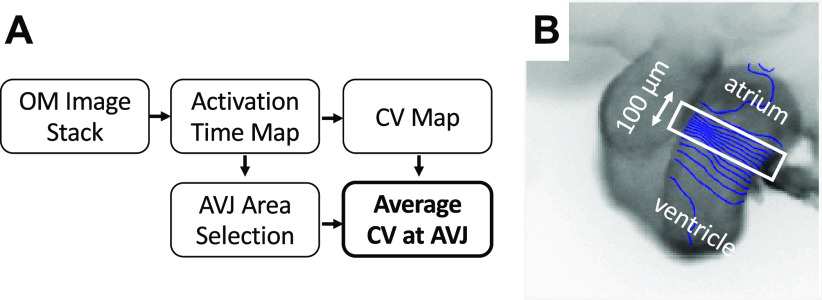
Figure 1.
Calculating average CV at AVJ from OM images. A: flowchart of processing an OM image stack. B: an activation time map of an HH stage 20 heart overlaid with 10 ms isochrones. The white rectangle is the manually selected area for calculating CV at AVJ. AVJ, atrioventricular junction; CV, conduction velocity; HH, Hamburger–Hamilton; OM, optical mapping.

