Figure 2.

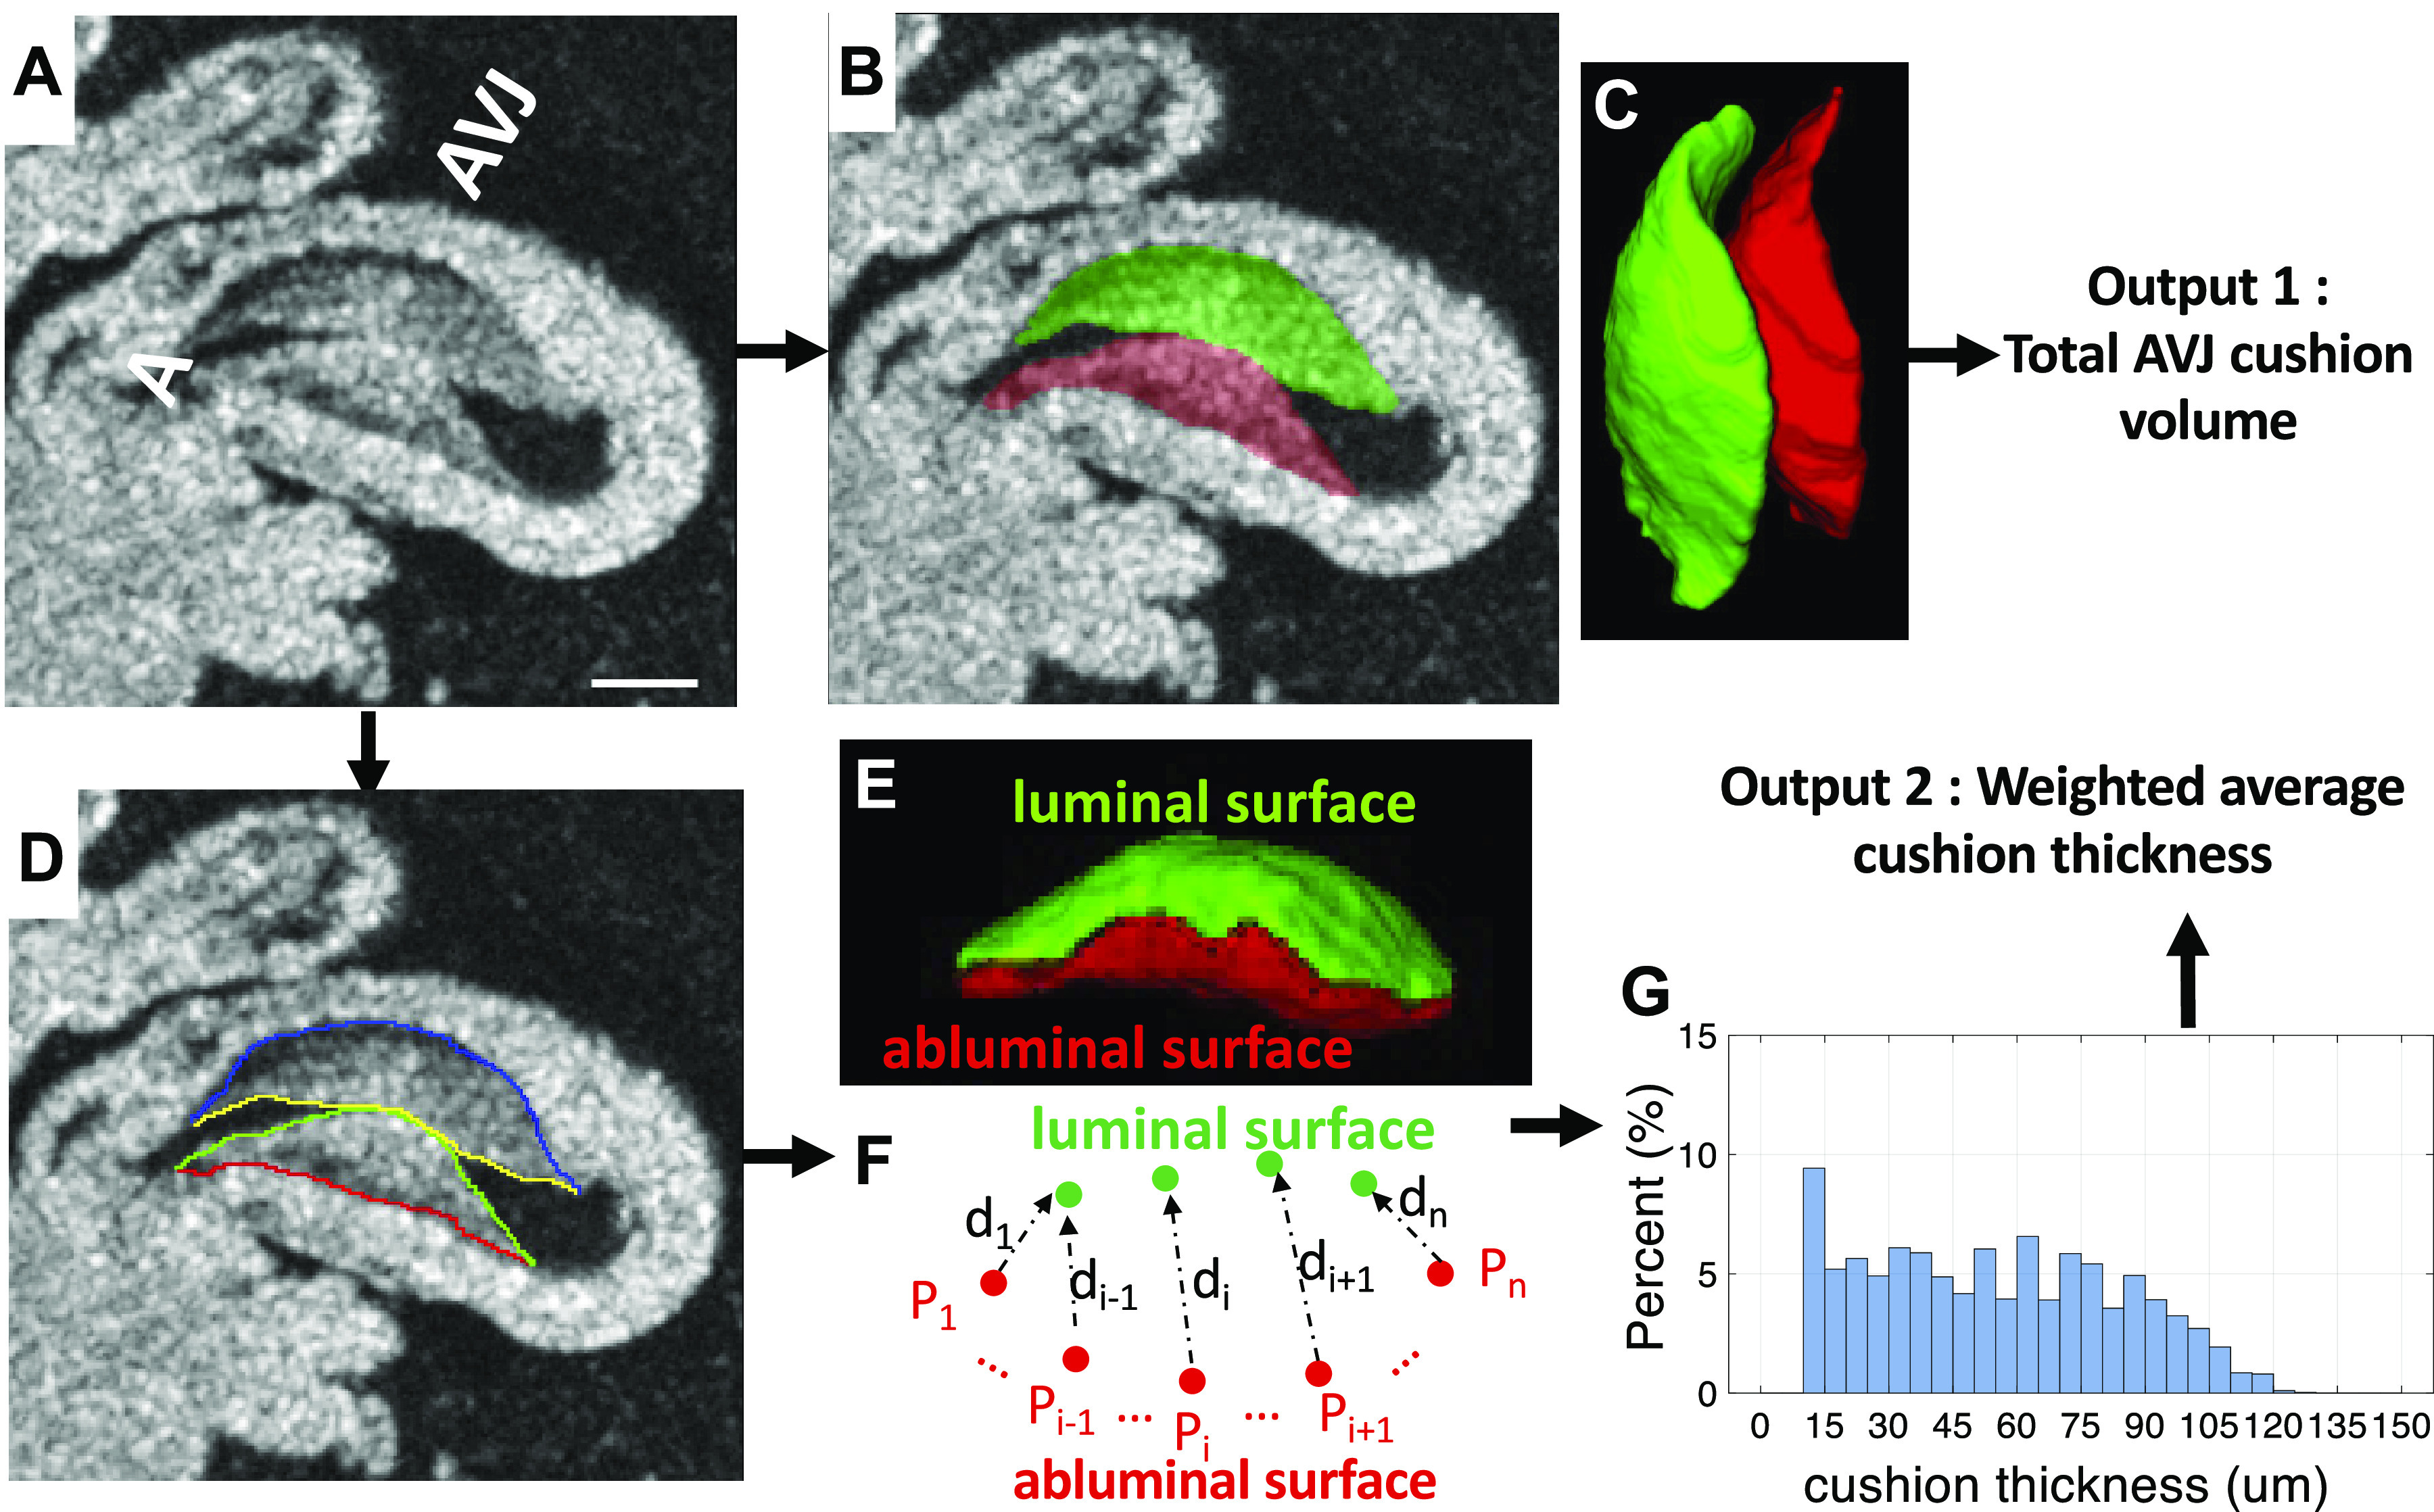
Calculating total cushion volume and average cushion thickness at the AVJ from volumetric OCT data. A: a 2-D slice from a volumetric OCT image stack. Scale bar = 200 μm. B: manual segmentation of AV superior (green) and inferior (red) cushions. C: 3-D rendering of the two AV cushions. D: the luminal and abluminal surfaces of each cushion were manually labeled. E: 3-D rendering of the luminal surface (green) and abluminal surface (red) of the inferior cushion. F: for every point on the abluminal surface Pi (1<i<n), (n is the number of points on the abluminal surface), the closest point on the luminal surface is found and the distance di between the two points is the cushion thickness at point Pi. G: the histogram of cushion thickness calculated at all points. The y-axis is the frequency of a particular cushion thickness value. A, atrium; AVJ, atrioventricular junction; OCT, optical coherence tomography; 2-D, two-dimensional; 3-D, three-dimensional; Vt, ventricle.
