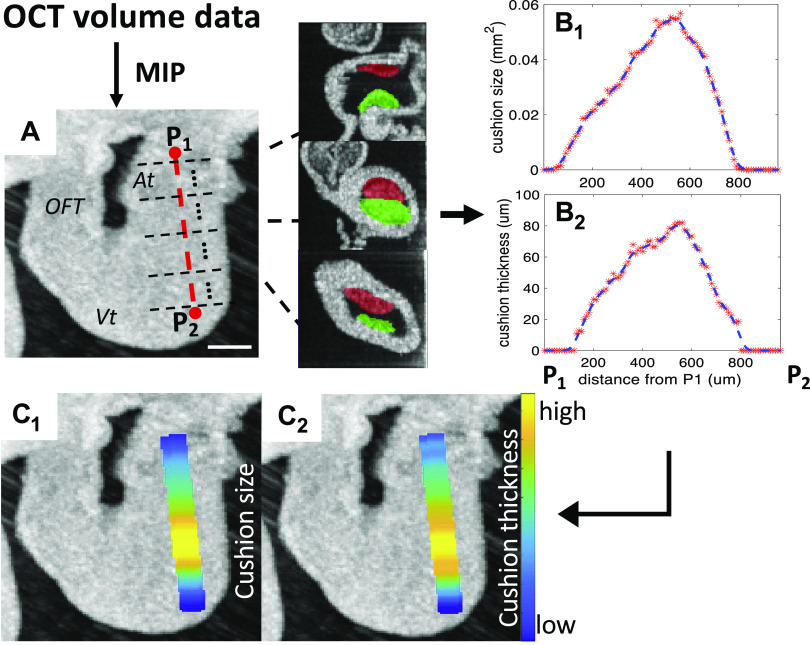
Figure 3.
The flowchart of calculating the cushion size and cushion thickness along the inflow heart tube. A: the OCT en face projection calculated by MIP (maximum intensity projection) along the direction of the OCT illumination. The centerline (red-dotted line) of the inflow heart tube was manually selected from the en face OCT projection. P1 and P2 are two end points of the centerline. Image planes (black-dotted lines) perpendicular to this centerline were extracted. Scale bar = 200 μm. B1: plot of the cushion cross-sectional area (mm2) along the heart tube from P1 to P2. Each red point on the curve is the size of the cushion area in each image slice. The dotted blue line is the smoothed size curve. B2: the curve of the average cushion thickness (μm) along the heart tube from P1 to P2. Each red point on the curve is the average thickness of the cushion area in each image slice. The dotted blue line is the smoothed thickness curve. C1: the en face OCT projection image overlaid by the size curve in B1. C2: The en face OCT projection image overlaid by the thickness curve in B2. At, atrium; OCT, optical coherence tomography; OFT, outflow tract; Vt, ventricle.

